A Tutorial to Build Your Own Air Monitoring Sensor! 

 Incorporating instructions and open-source software from @Luftdaten
 With Arduino open-source hardware
Task 0: The Tools You Will Need 

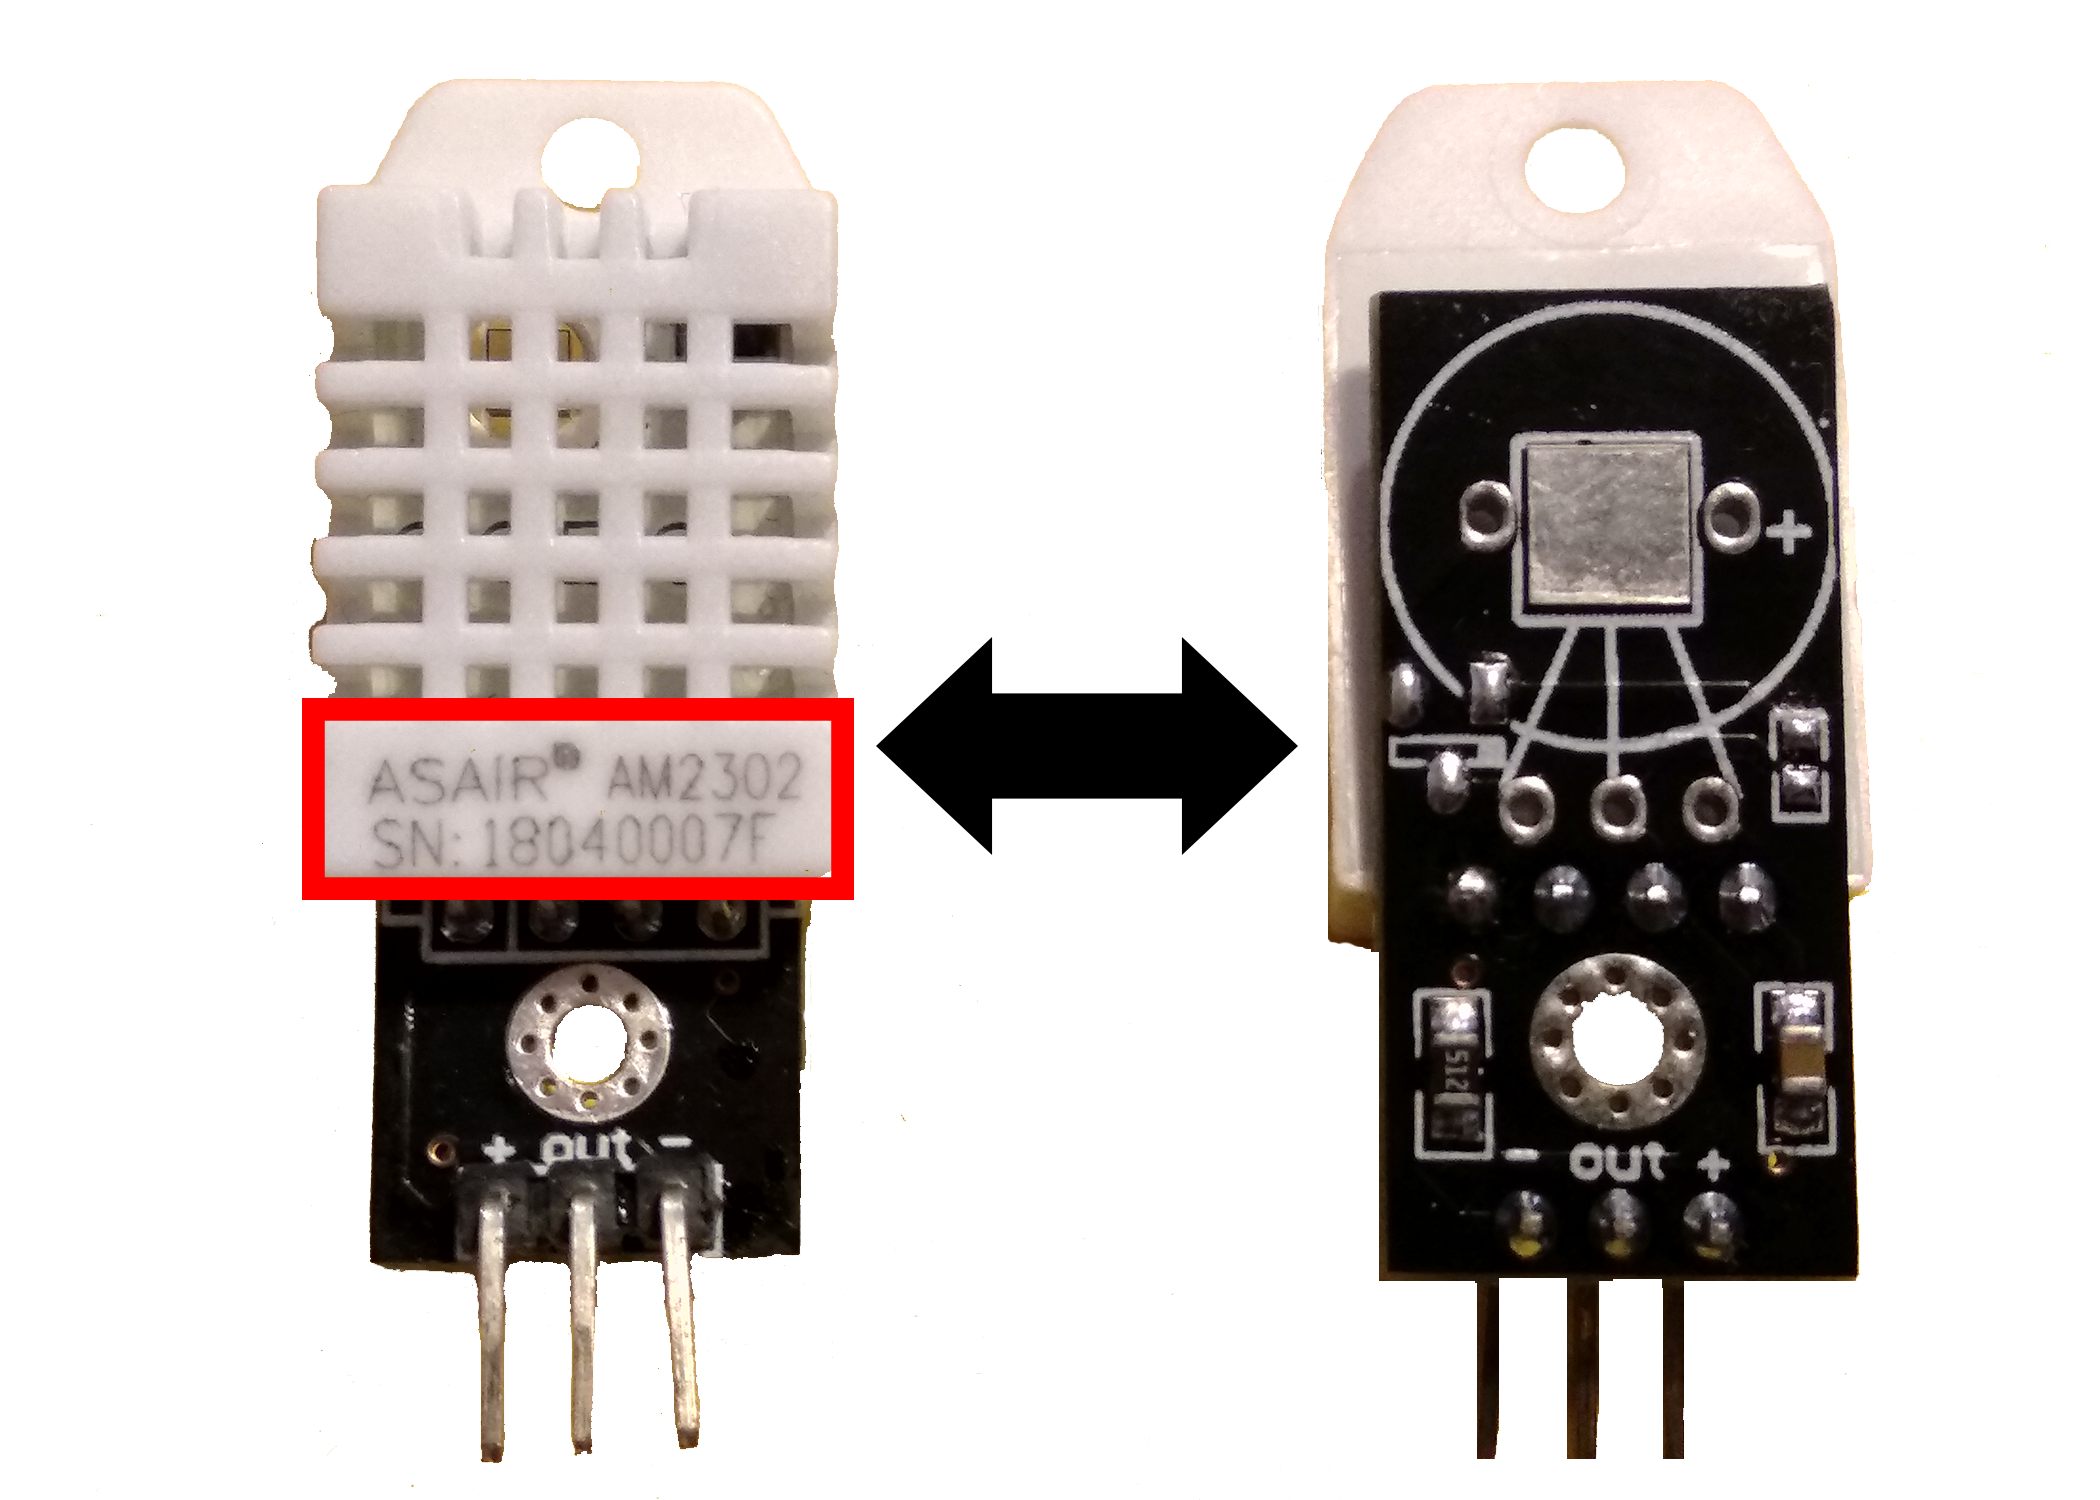
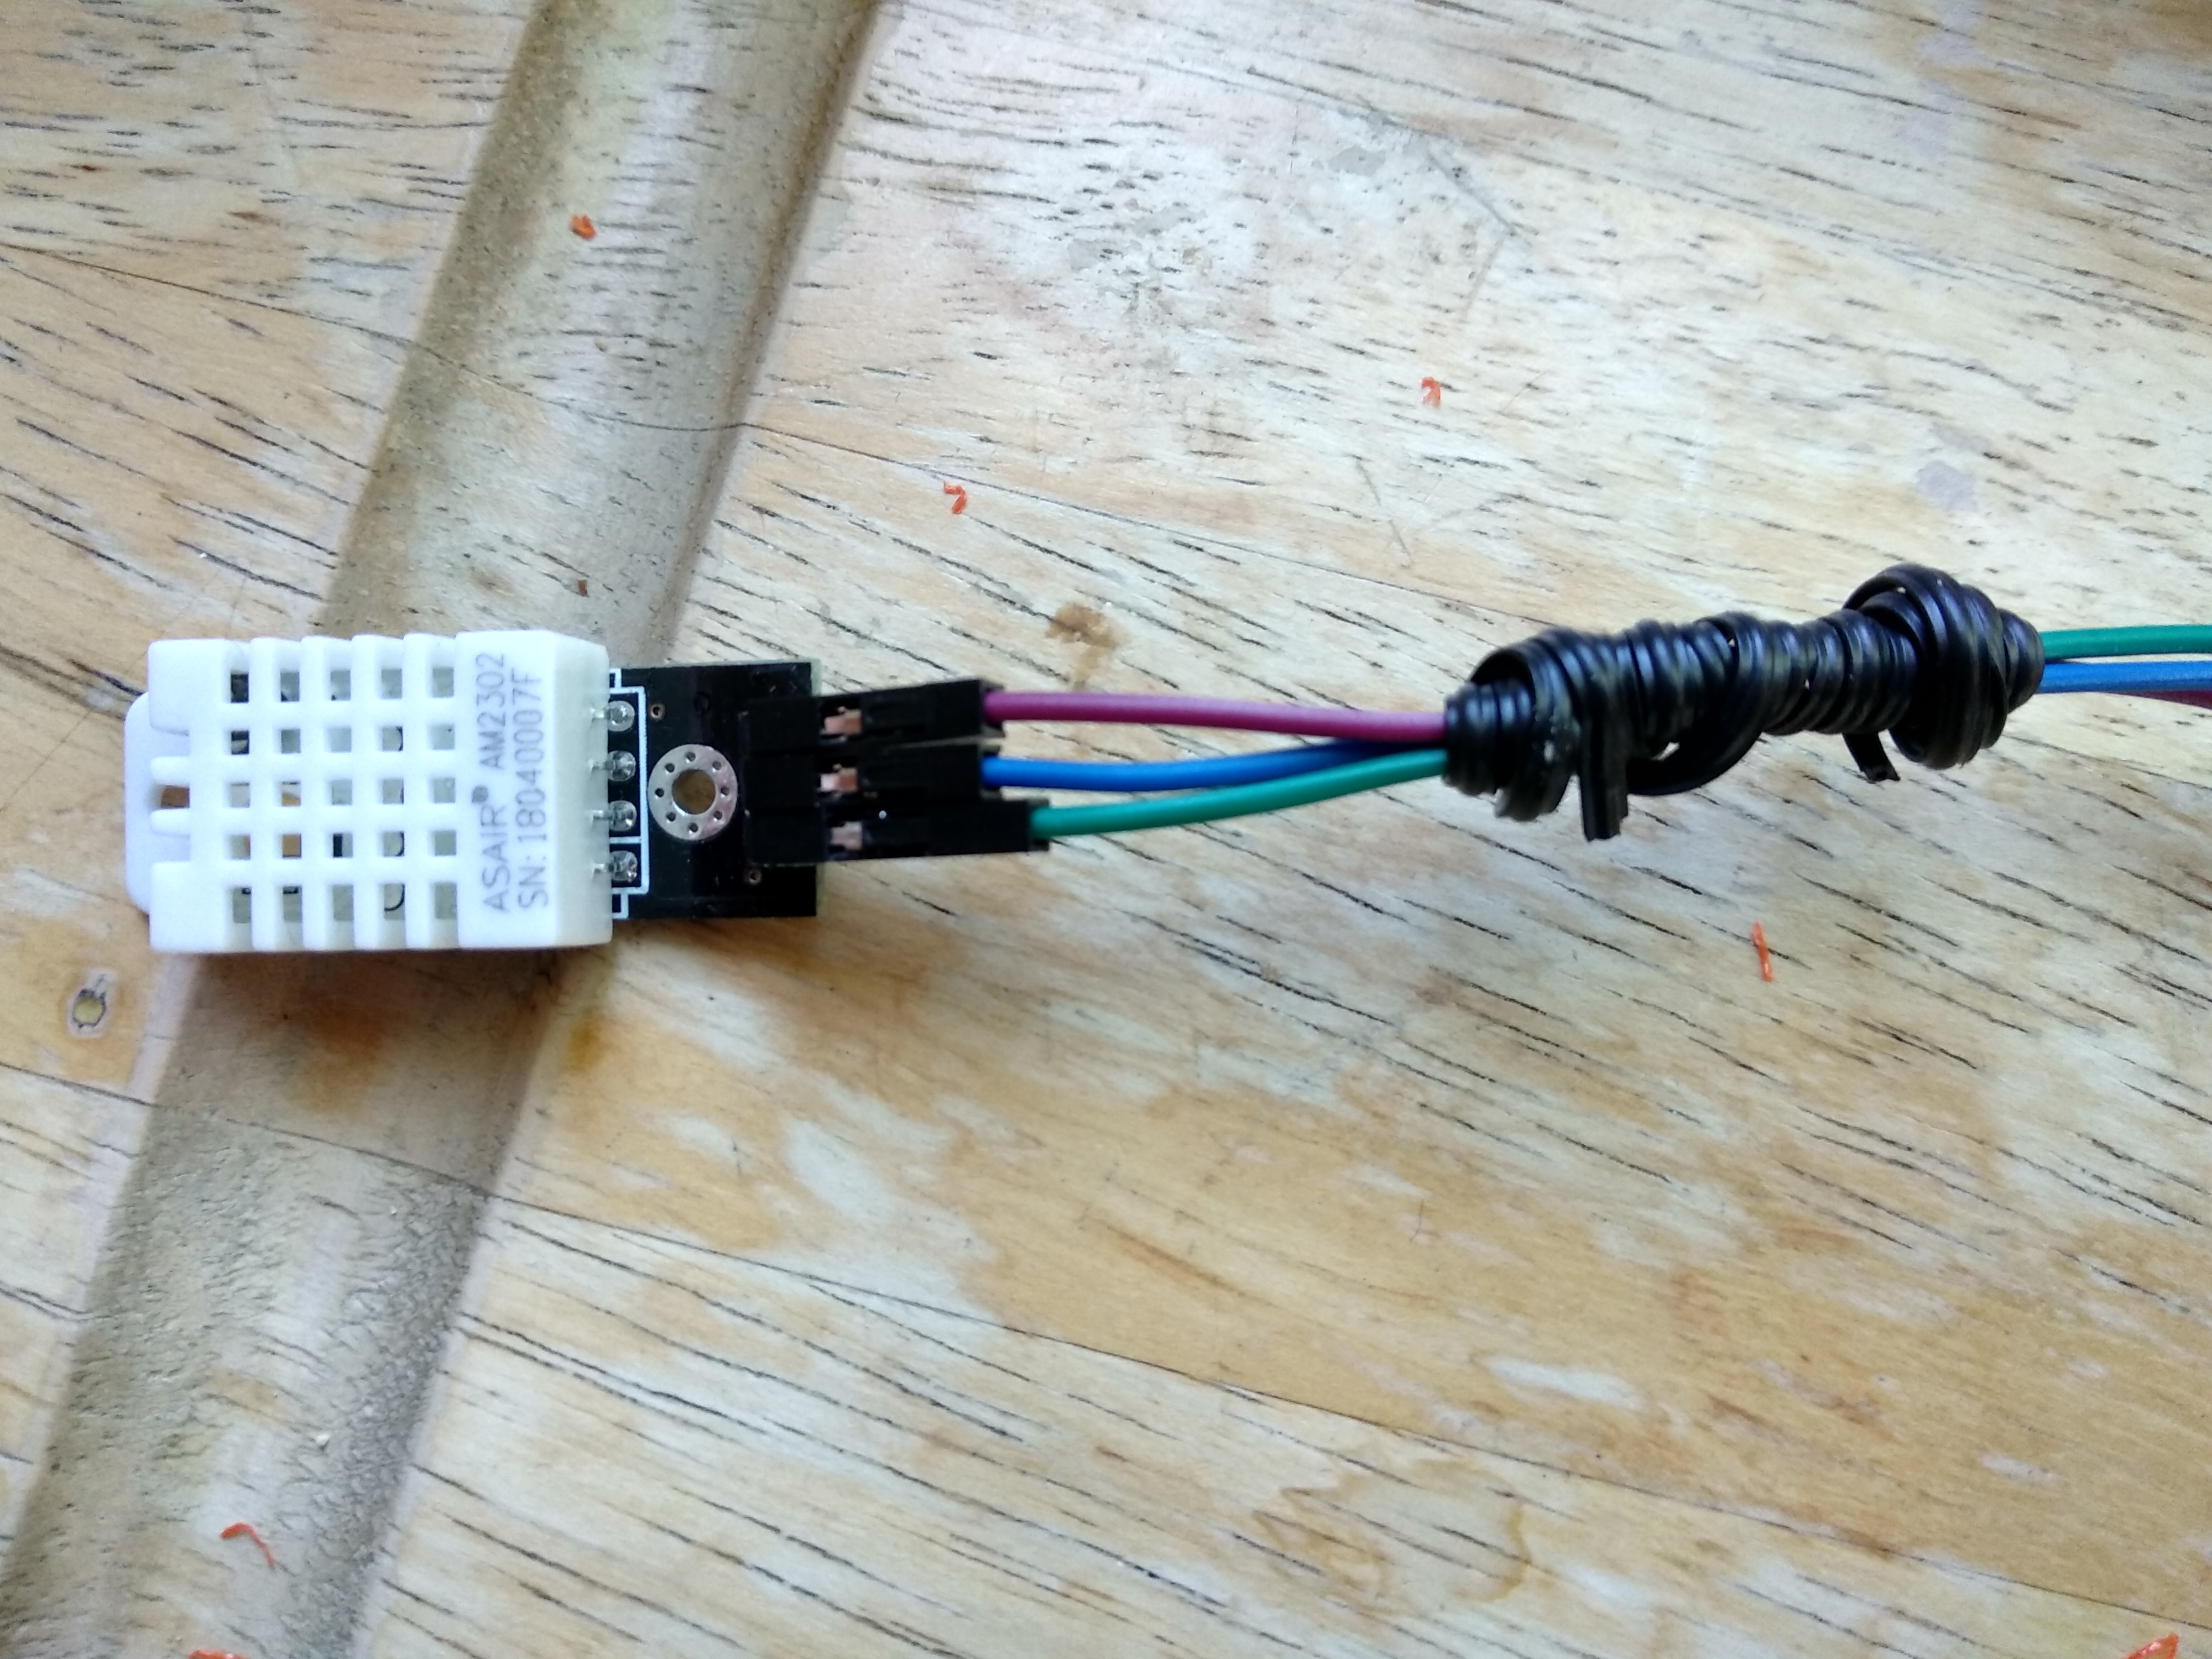
3. DHT22 Temperature Humidity Sensor* 

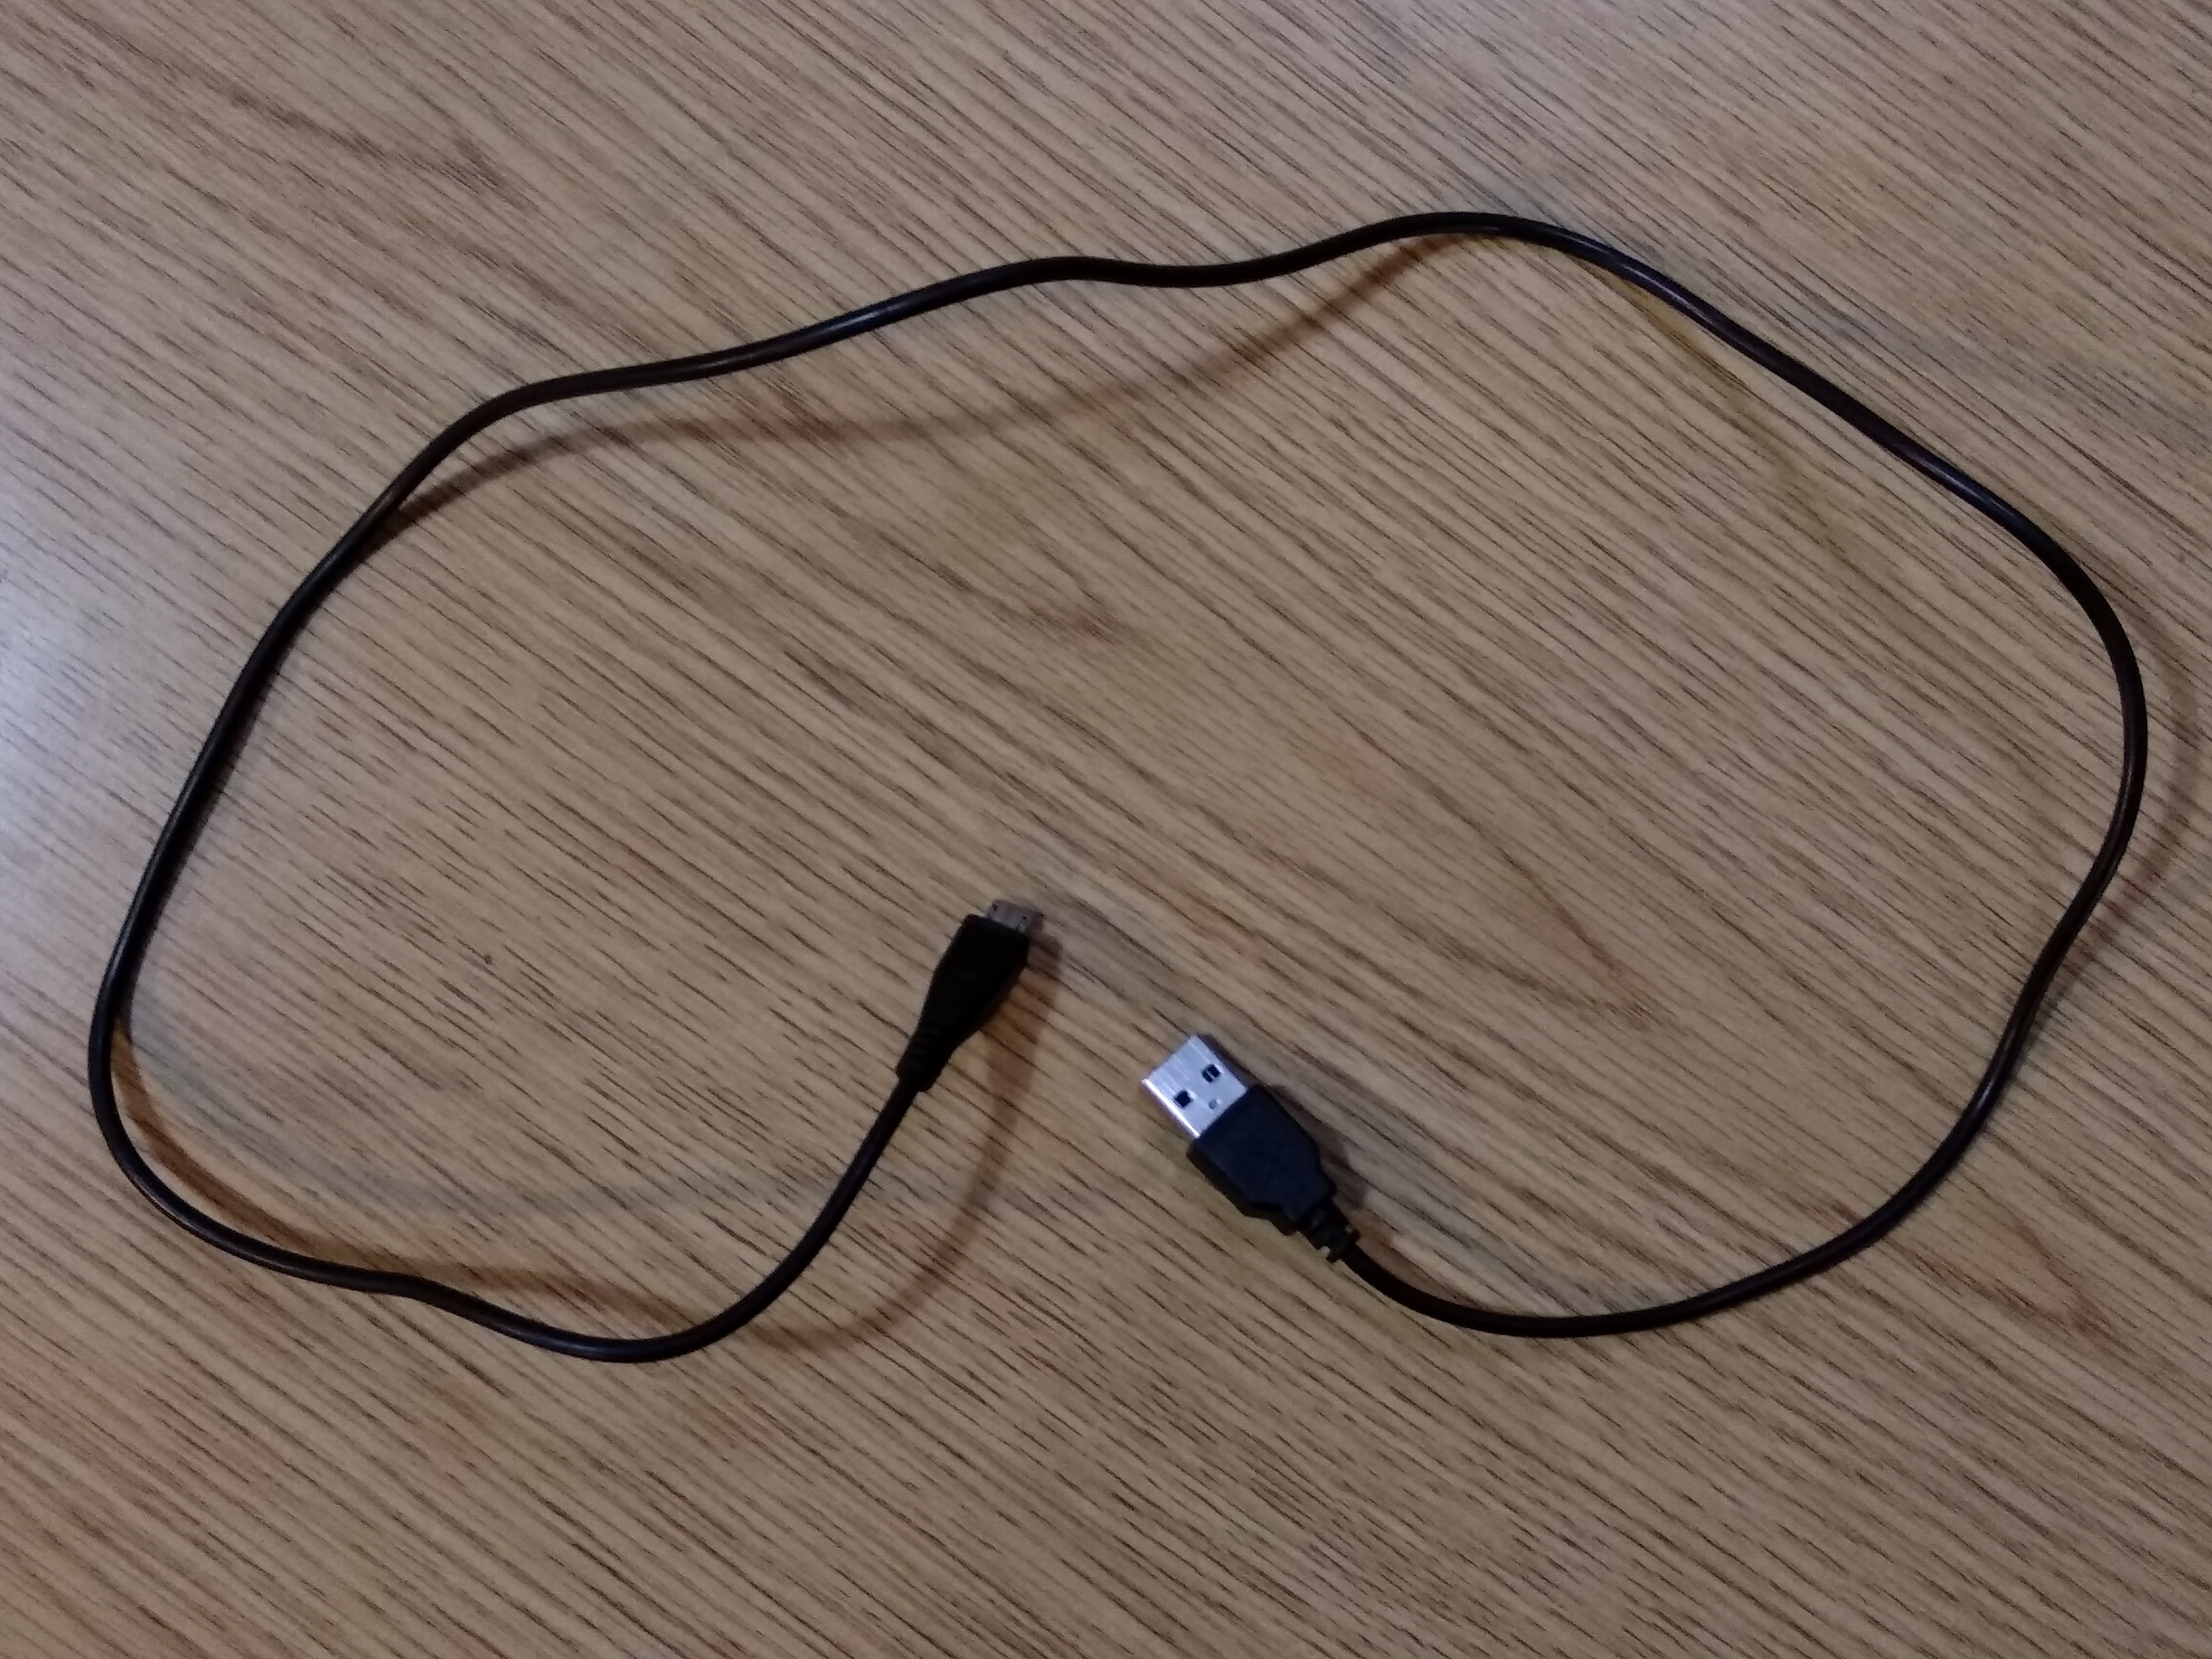
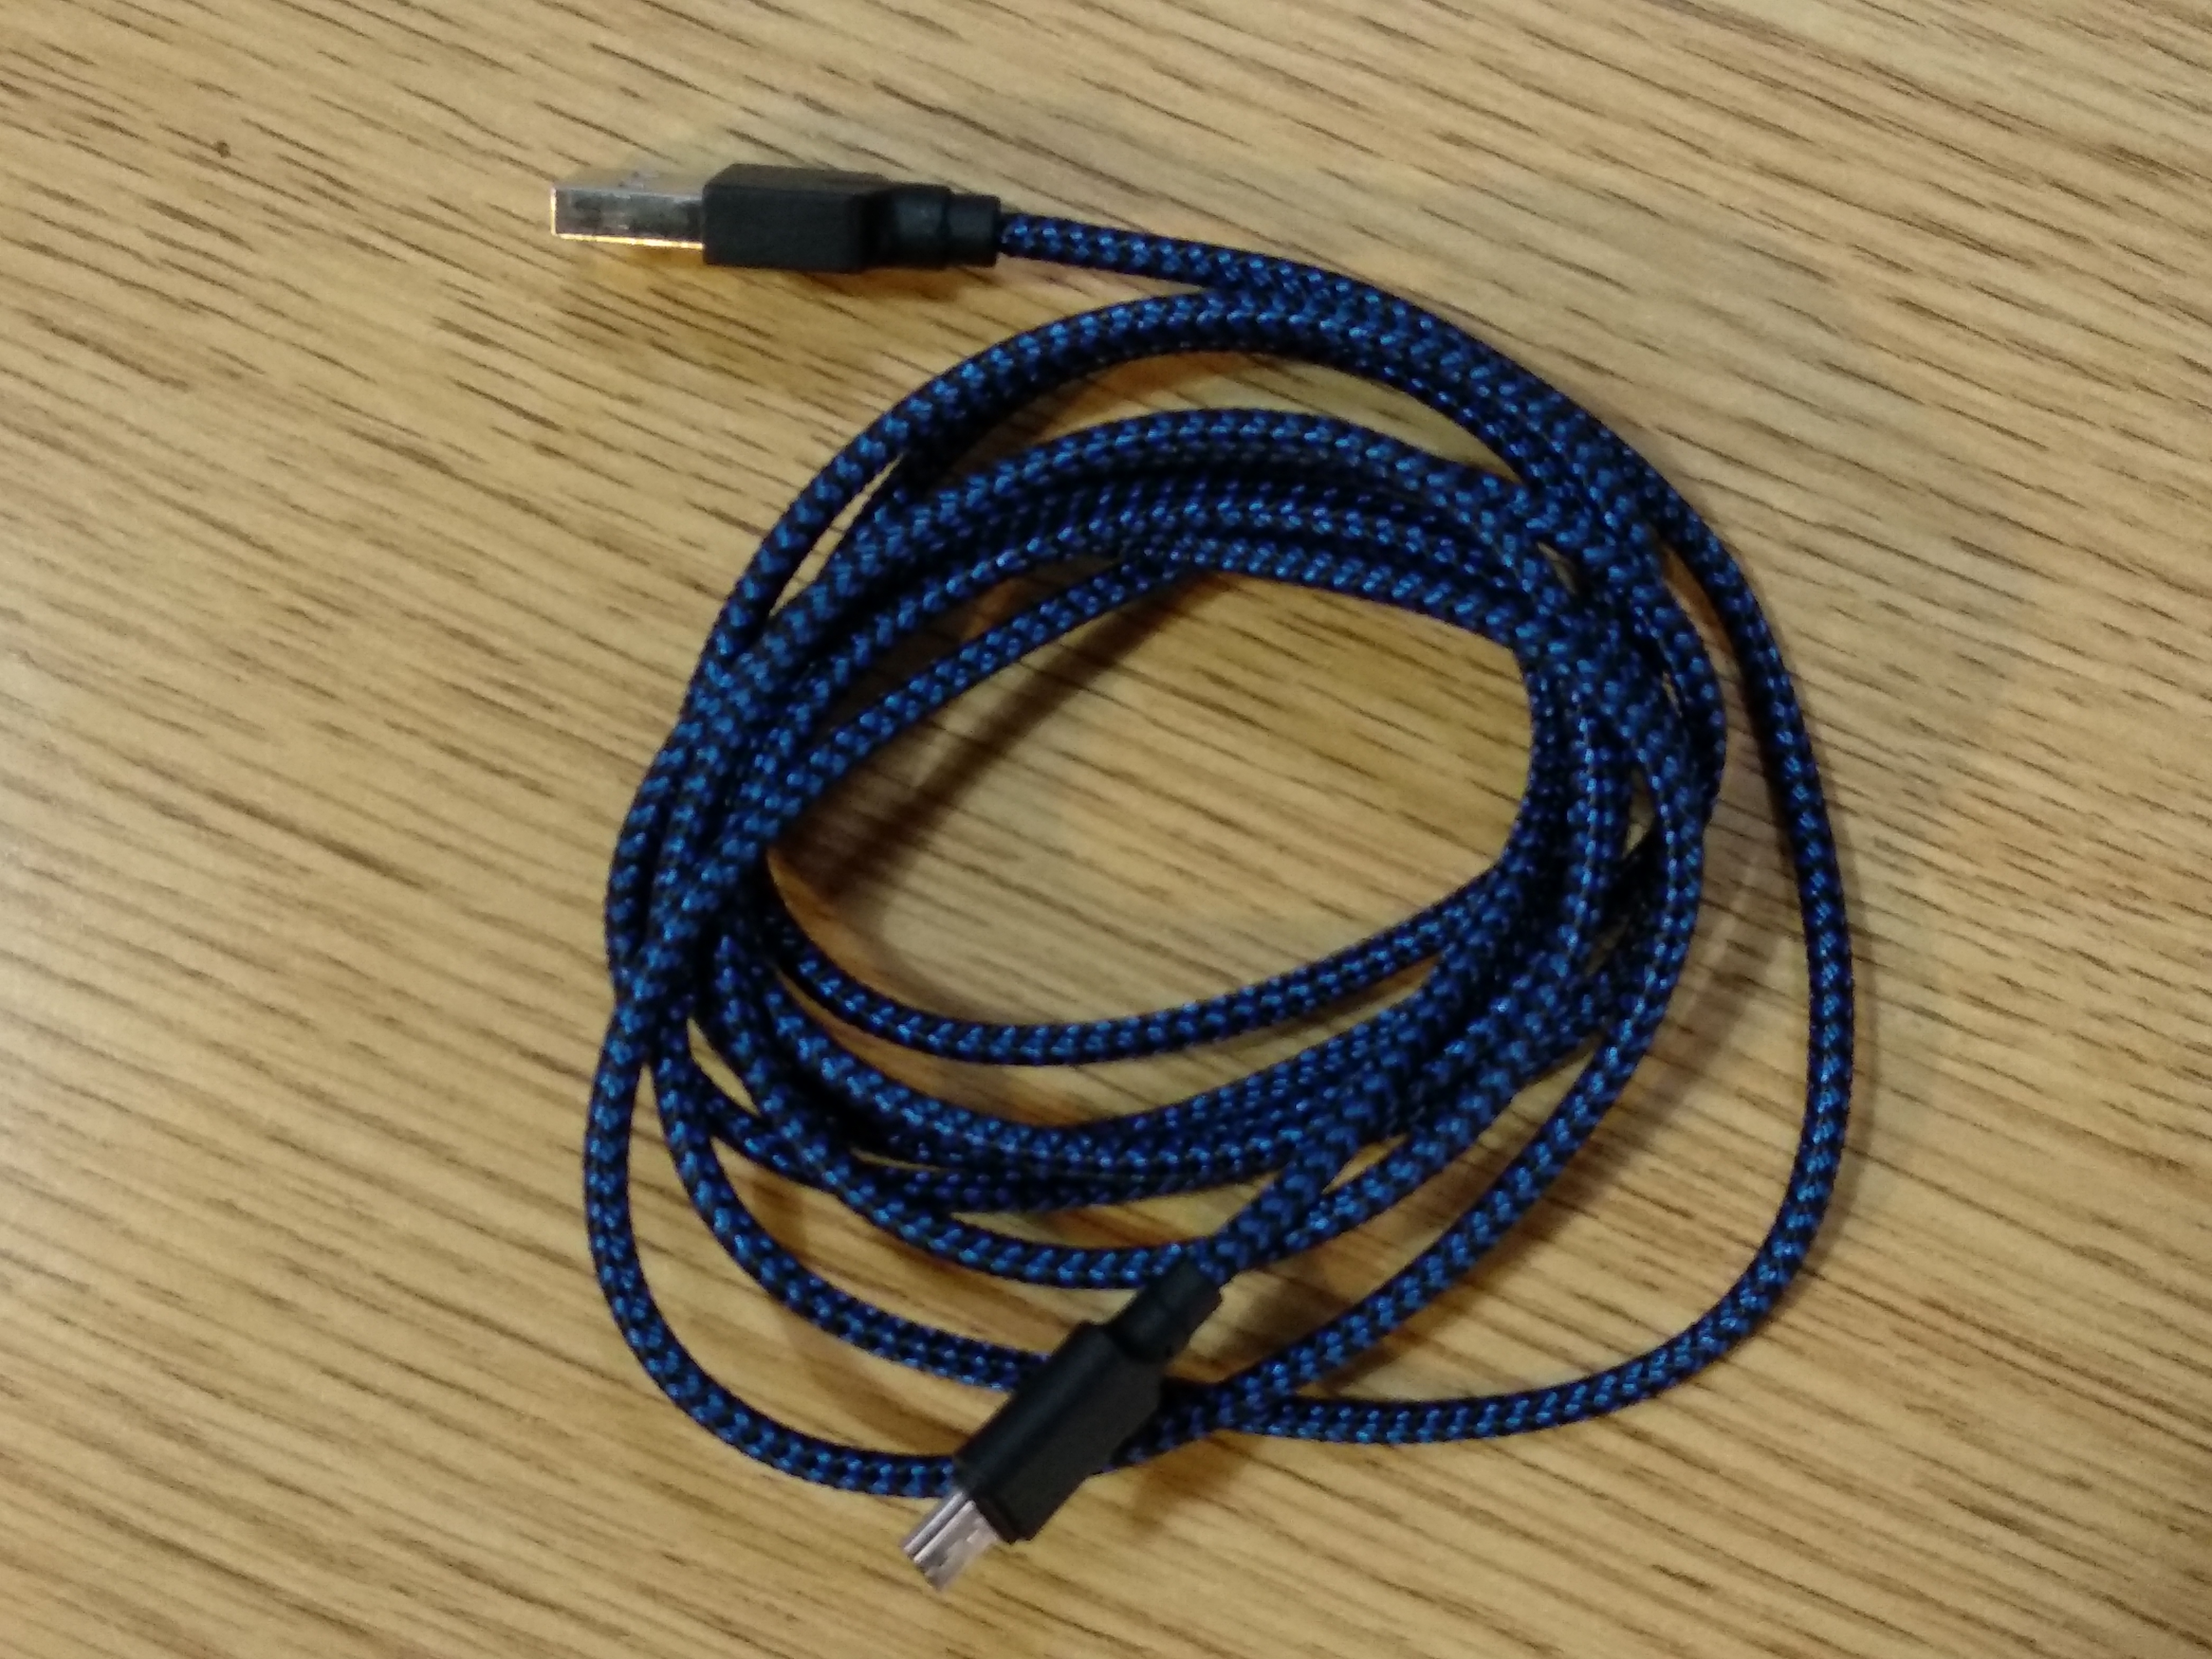
5. Flat Micro USB Cables* 

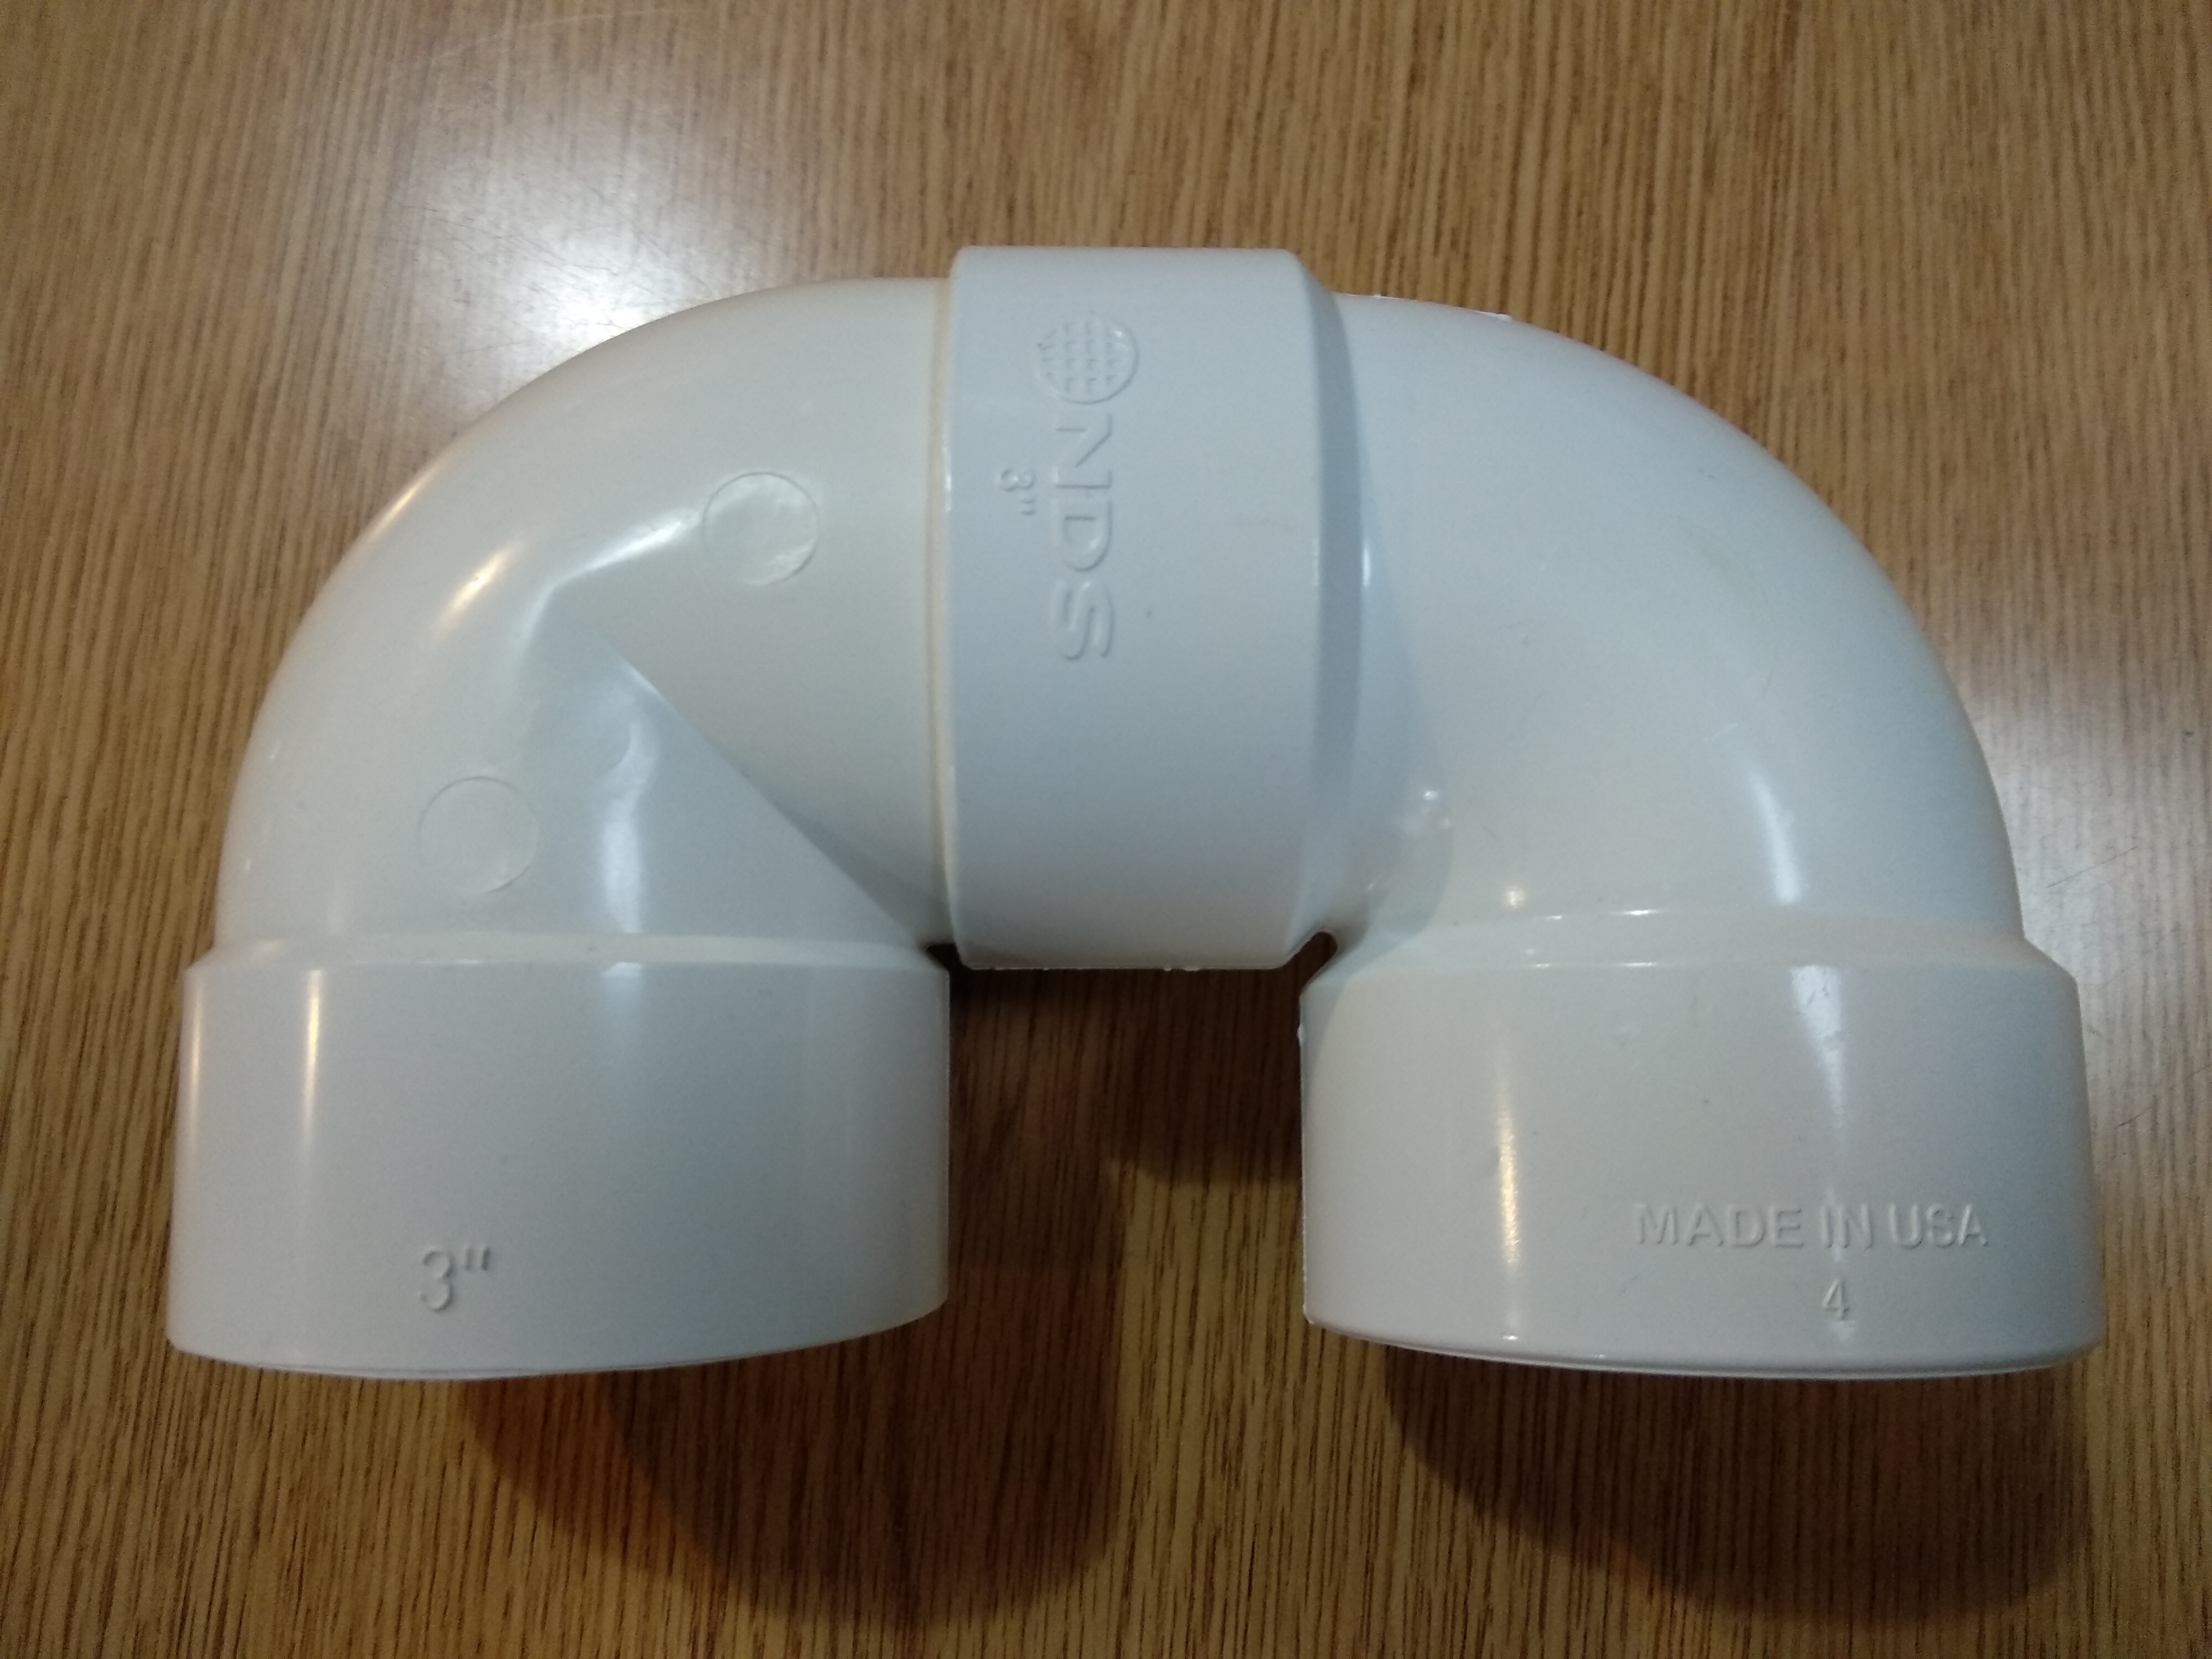
8. OPTIONAL: 90° PVC Pipes (3 inch / 2.55 cm)* 
And a healthy dose of perseverance & patience!

Estimated Cost (U.S. Dollar, 2019) 
| ID | Components | Amazon | AliExpress | Bang Good |
|---|---|---|---|---|
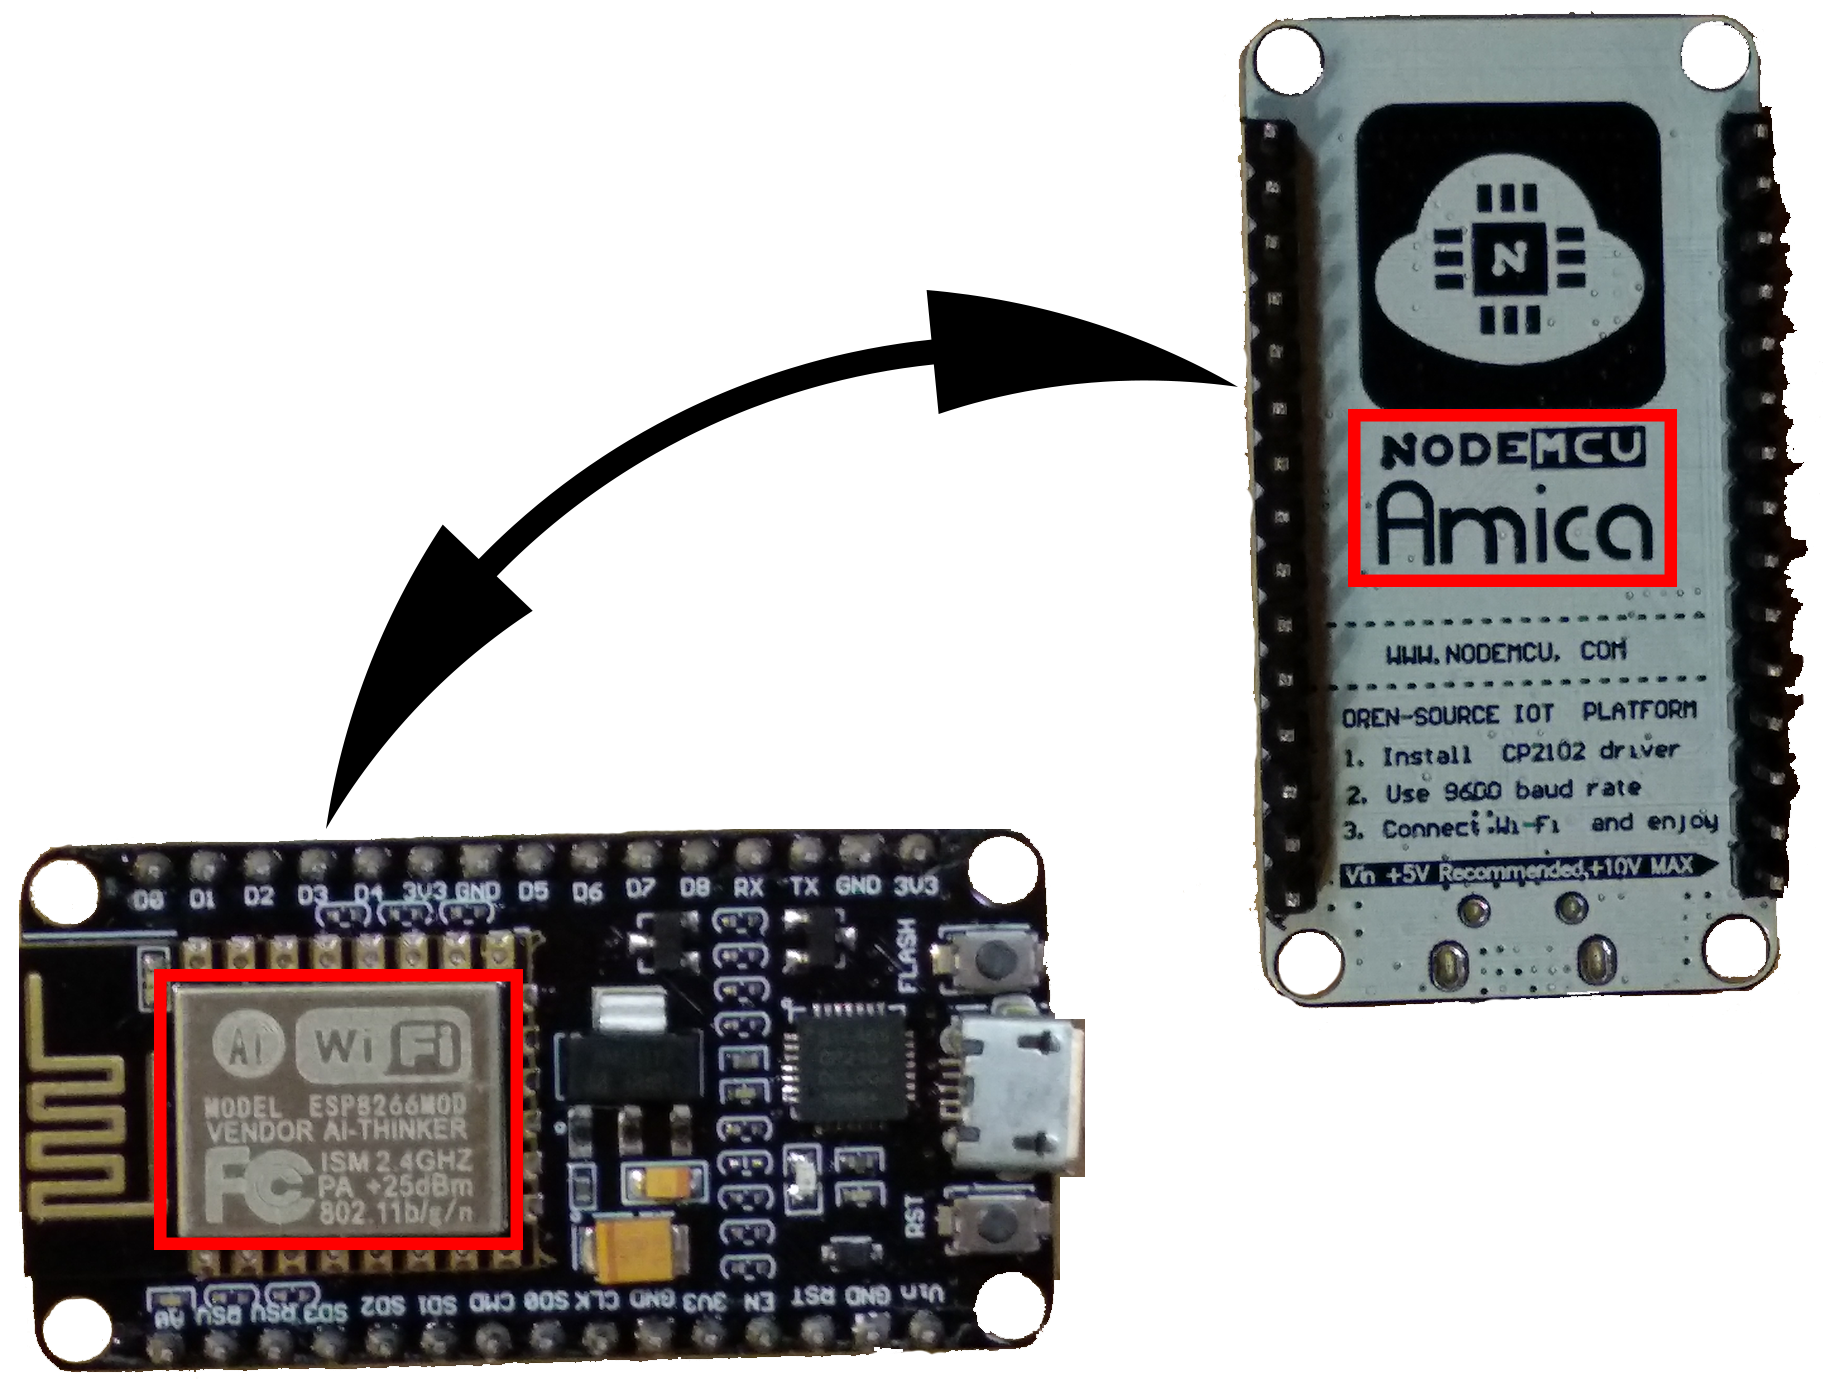
| 1 | ESP8266 NodeMCU | 8.39 | 2.10 | 6.33 |
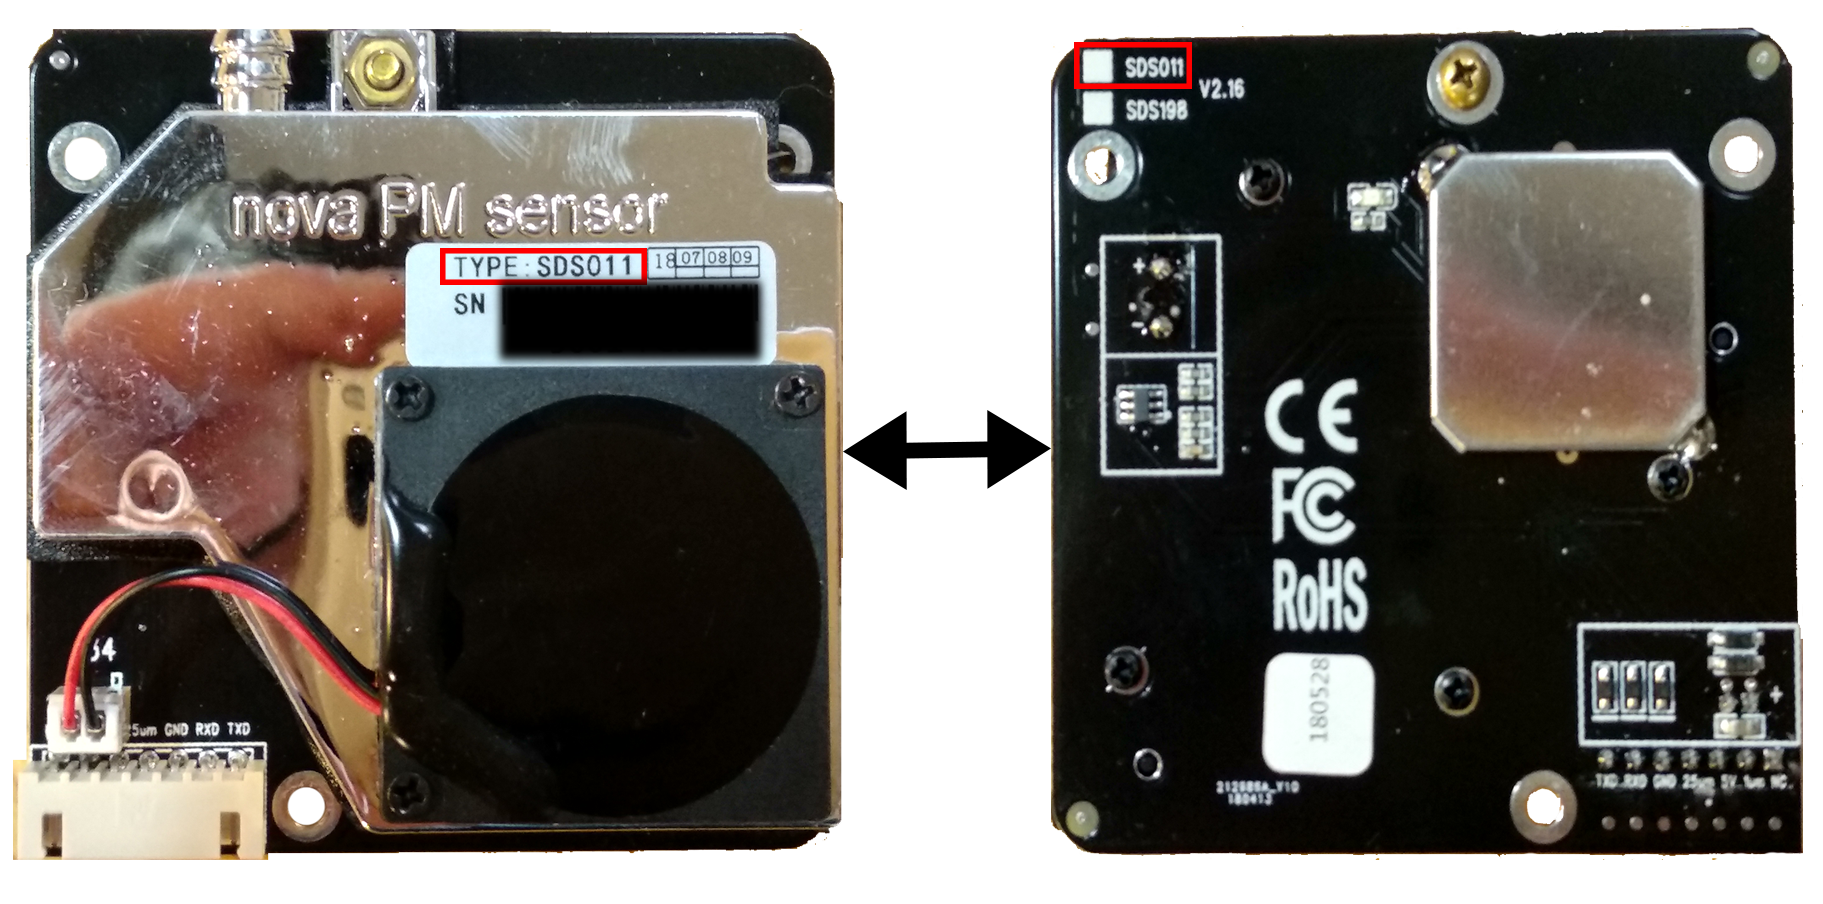
| 2 | Nova PM Sensor SDS01 | 40.38 | 16.40 | 19.99 |
| 3 | DHT22 Temperature Humidity Sensor | 12.90 | 2.45 | 6.53 |
| 4 | Dupont Cables (female-to-female) | 6.98 | 0.45 | 3.96 |
| 5 | Flat Micro USB Cable 2.1A (< 1m) | 2.27 | 1.00 | 3.22 |
| 5 | Flat Micro USB Cable 2.1A (Nylon, >=2m) | 9.69 | 3.99 | 2.89 |
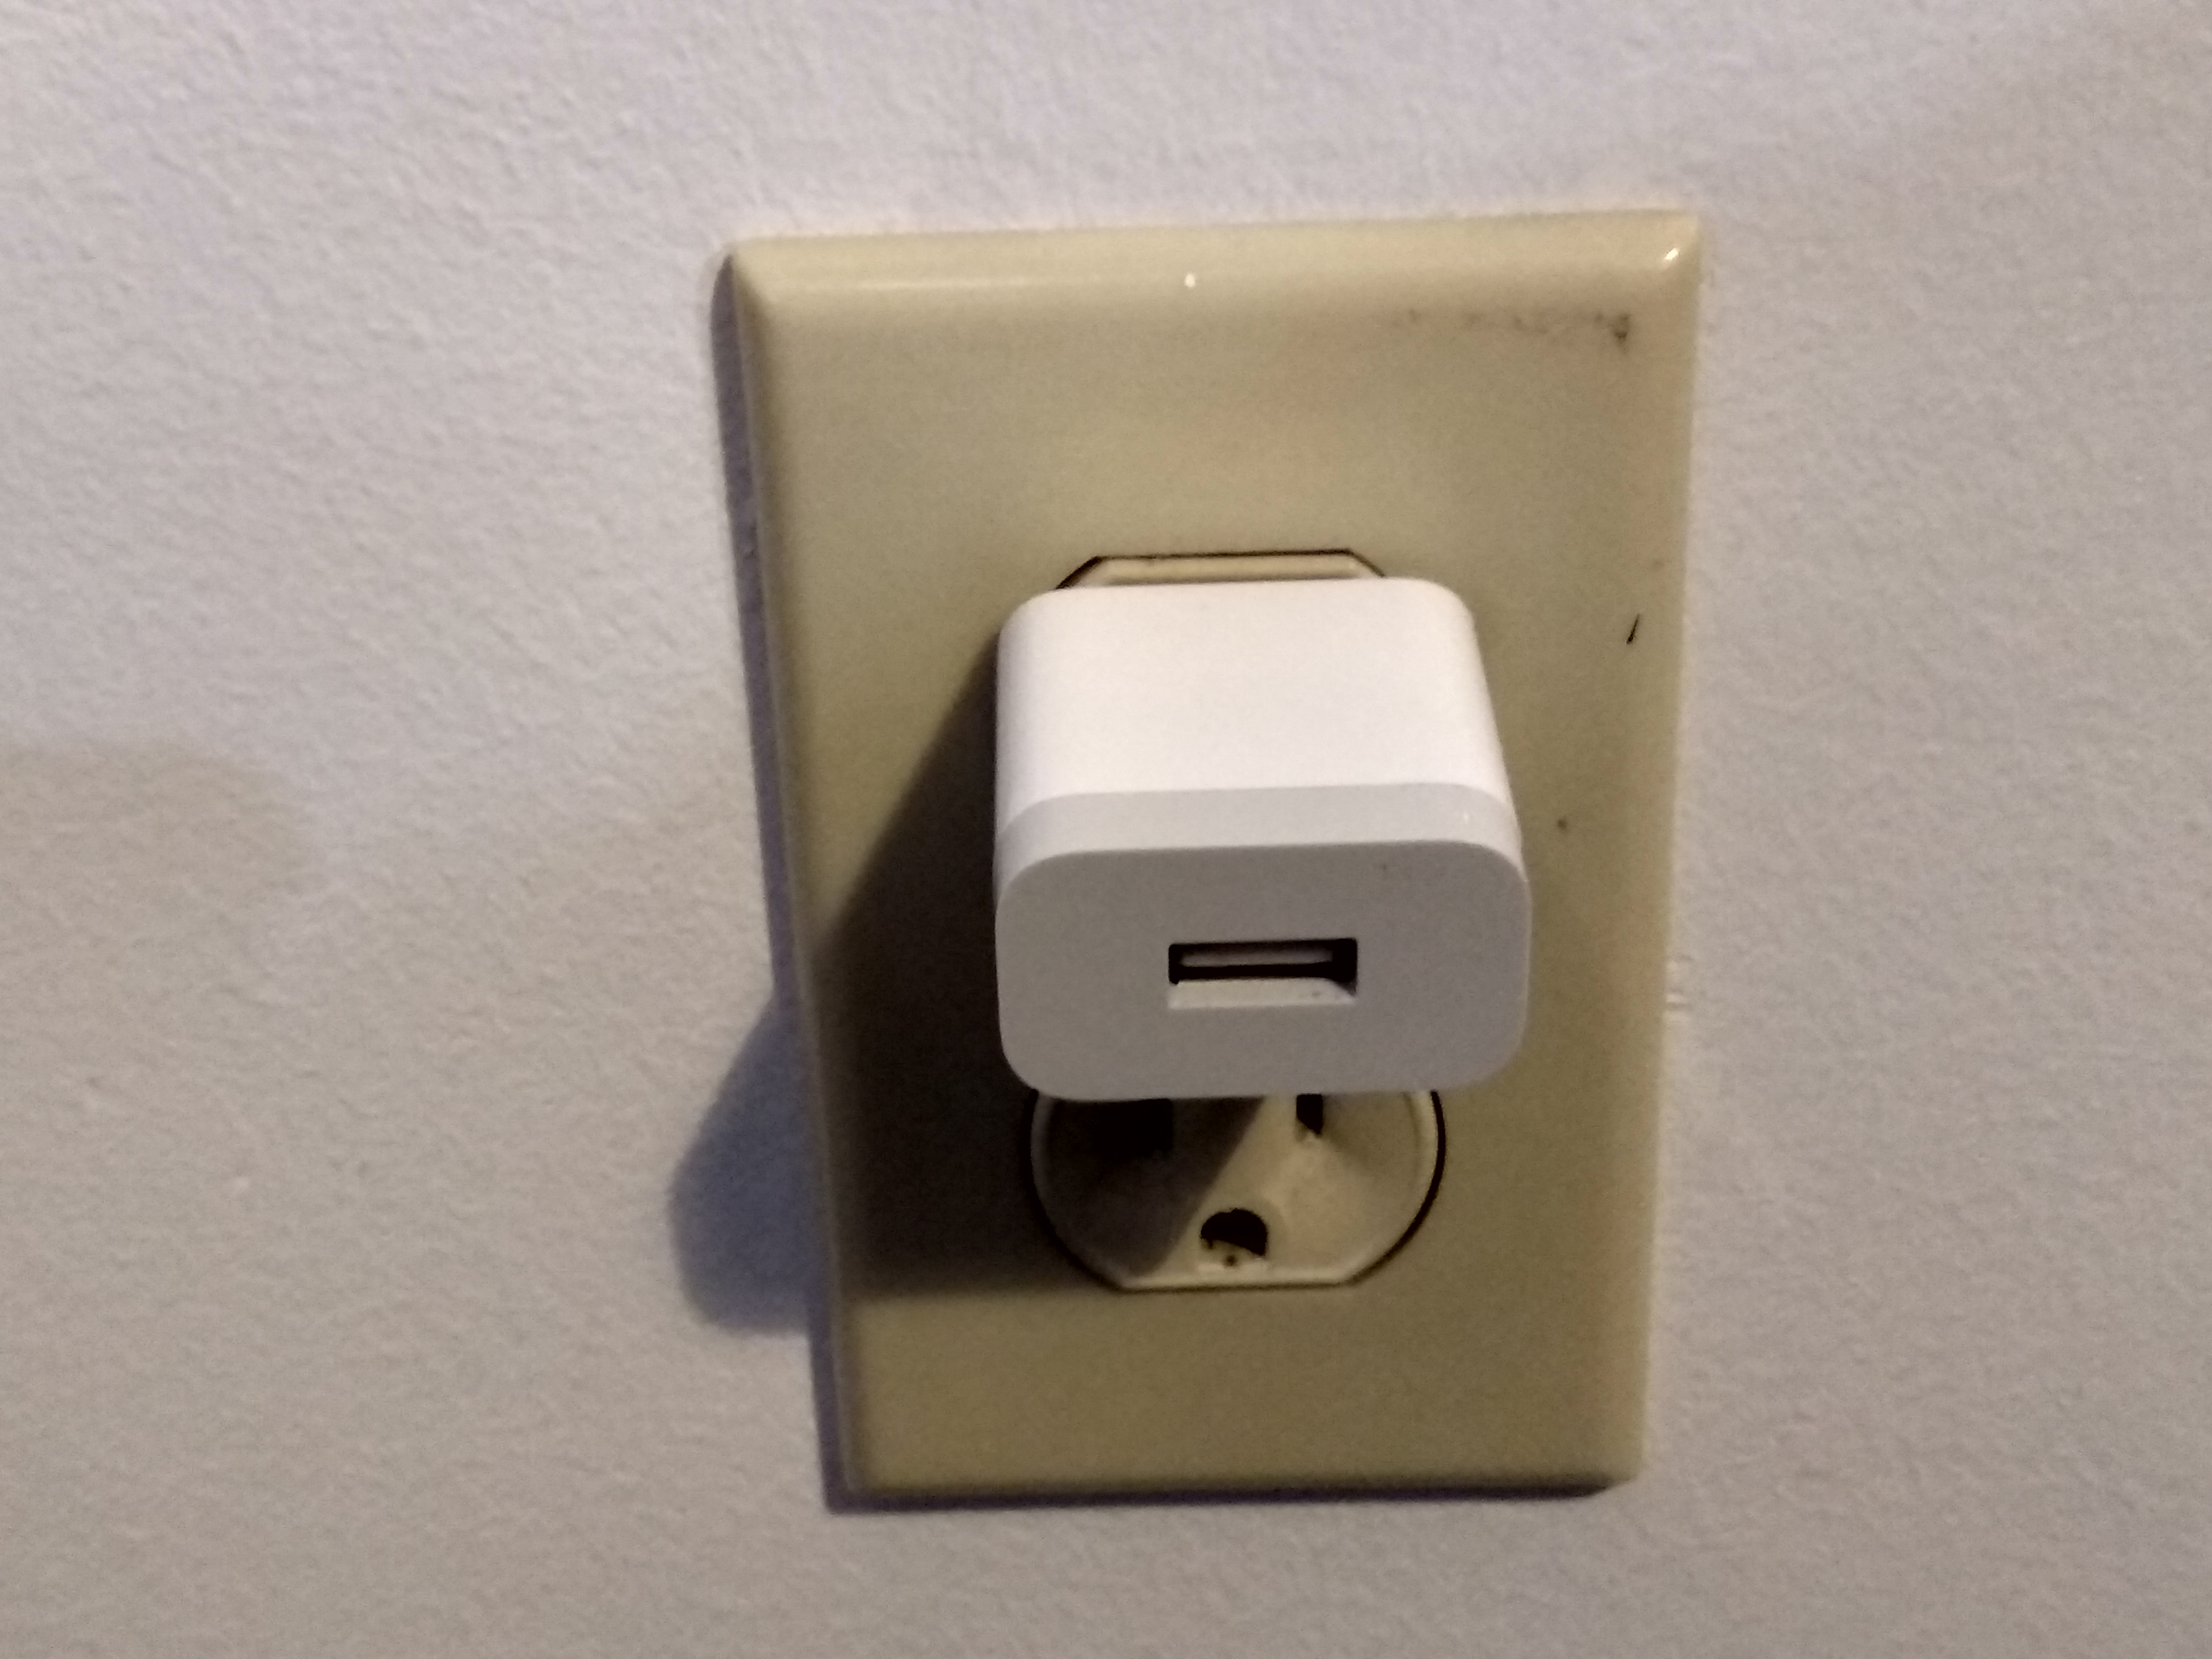
| 6 | USB to Wall Charger | 10.99 | 1.28 | 3.60 |
| 7 | 10 X 12mm Silicone Tube | 5.99 | 6.21 | 5.53 |
| 8 | 90° PVC Pipes (3 inch / 2.55 cm) | 8.07 | N/A | N/A |
The total may range from an estimated minimum of 40.17 to an estimated maximum of 106.61 US Dollars (not including shipping).
Task 1: Configure the Arduino Board 
INSTRUCTIONS FOR LINUX 
⚠️ You don't need to have the exact same parameters
If you do run into a problem, it's best practice to include a description of the parameters of your Operating System along with a description of your issue.You can search for issues and/or ask for help on the following sites:
1.1 INSTALL USB2SERIAL DRIVER 
What does it do?
It enables your computer to communicate (for example, transferring files and installing software) with the computer chip of the Arduino when connected to a USB port; otherwise it won't do anything other than power the arduino board.
No installation required for Linux, chip should be supported 

dmesg | grep -i ttyUSB

1.2 INSTALL THE ARDUINO IDE 

1.3 Open the IDE 
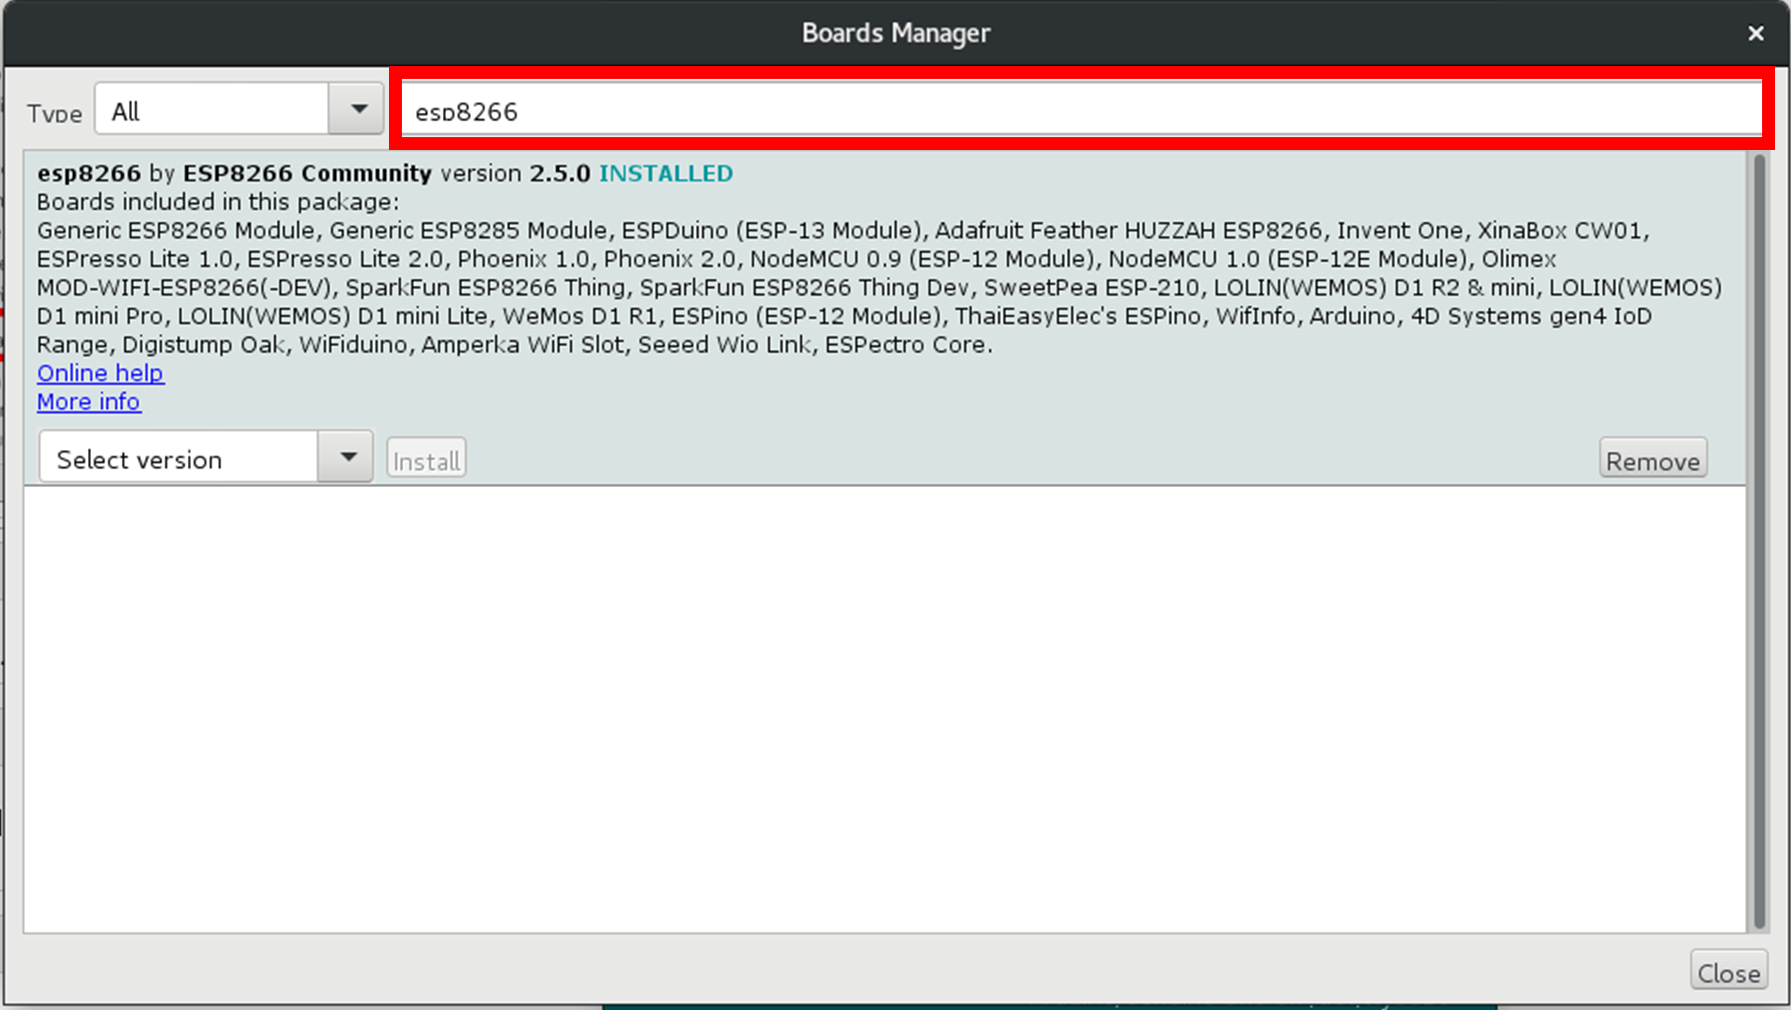
Install the libraries 
CLOSE THE ARDUINO IDE. 
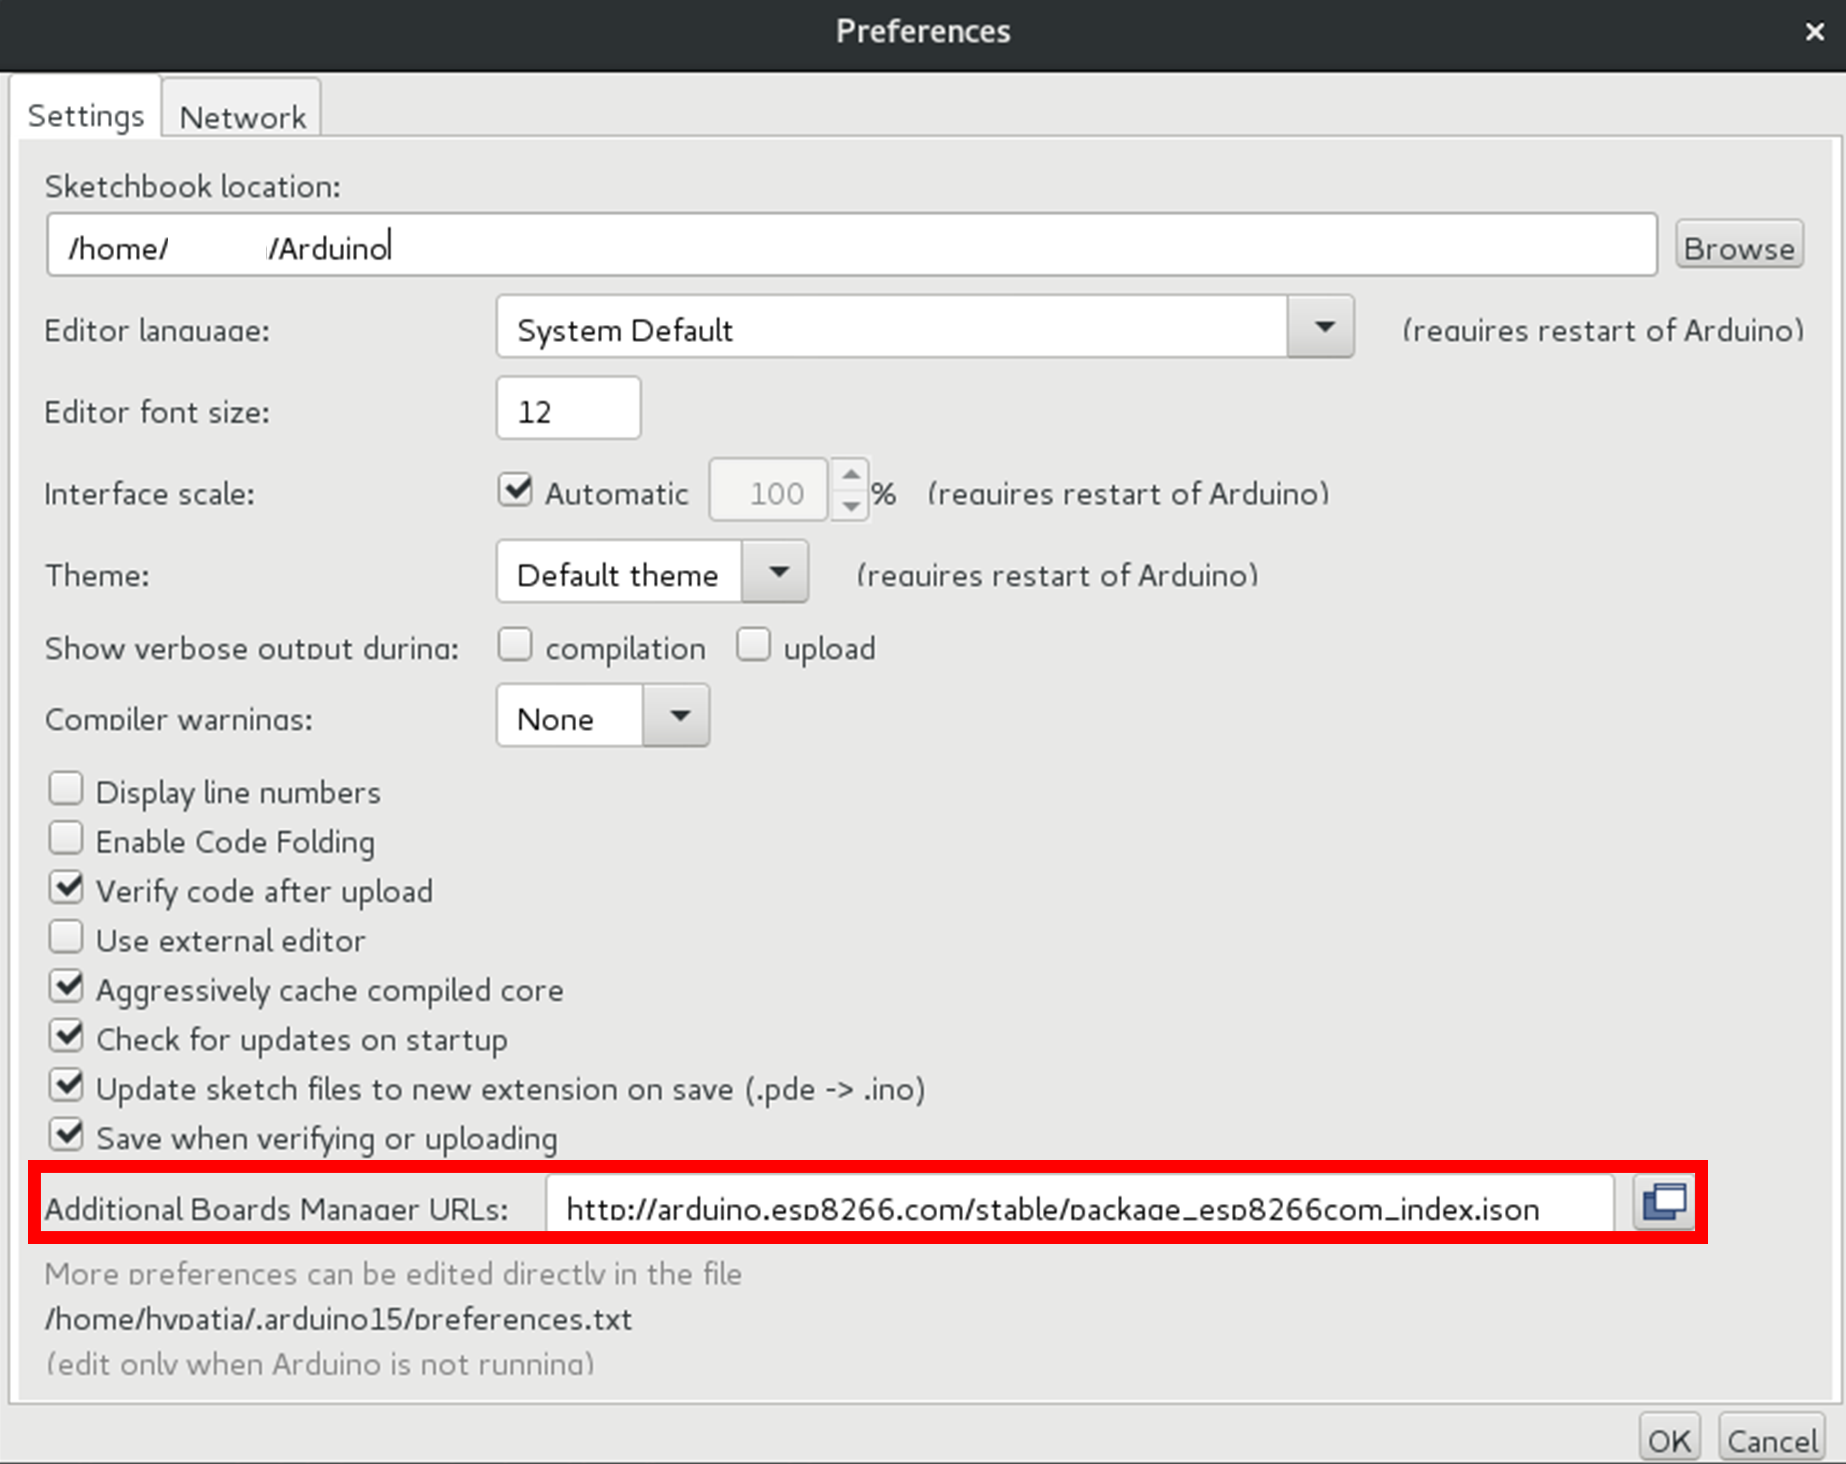
1.4 IMPORT LUFTDATEN'S FIRMWARE ON THE ARDUINO 
What does it do? 
The firmware--built by Luftdaten--configures the Wi-Fi connectivity of the Arduino board and stores the measurements from the SDH011 Dust Sensor and DHT11 Humidity and Temperature Sensor into Luftdaten's database.
The sourcecode of the firmware is available on GitHub.
Download the firmware here 
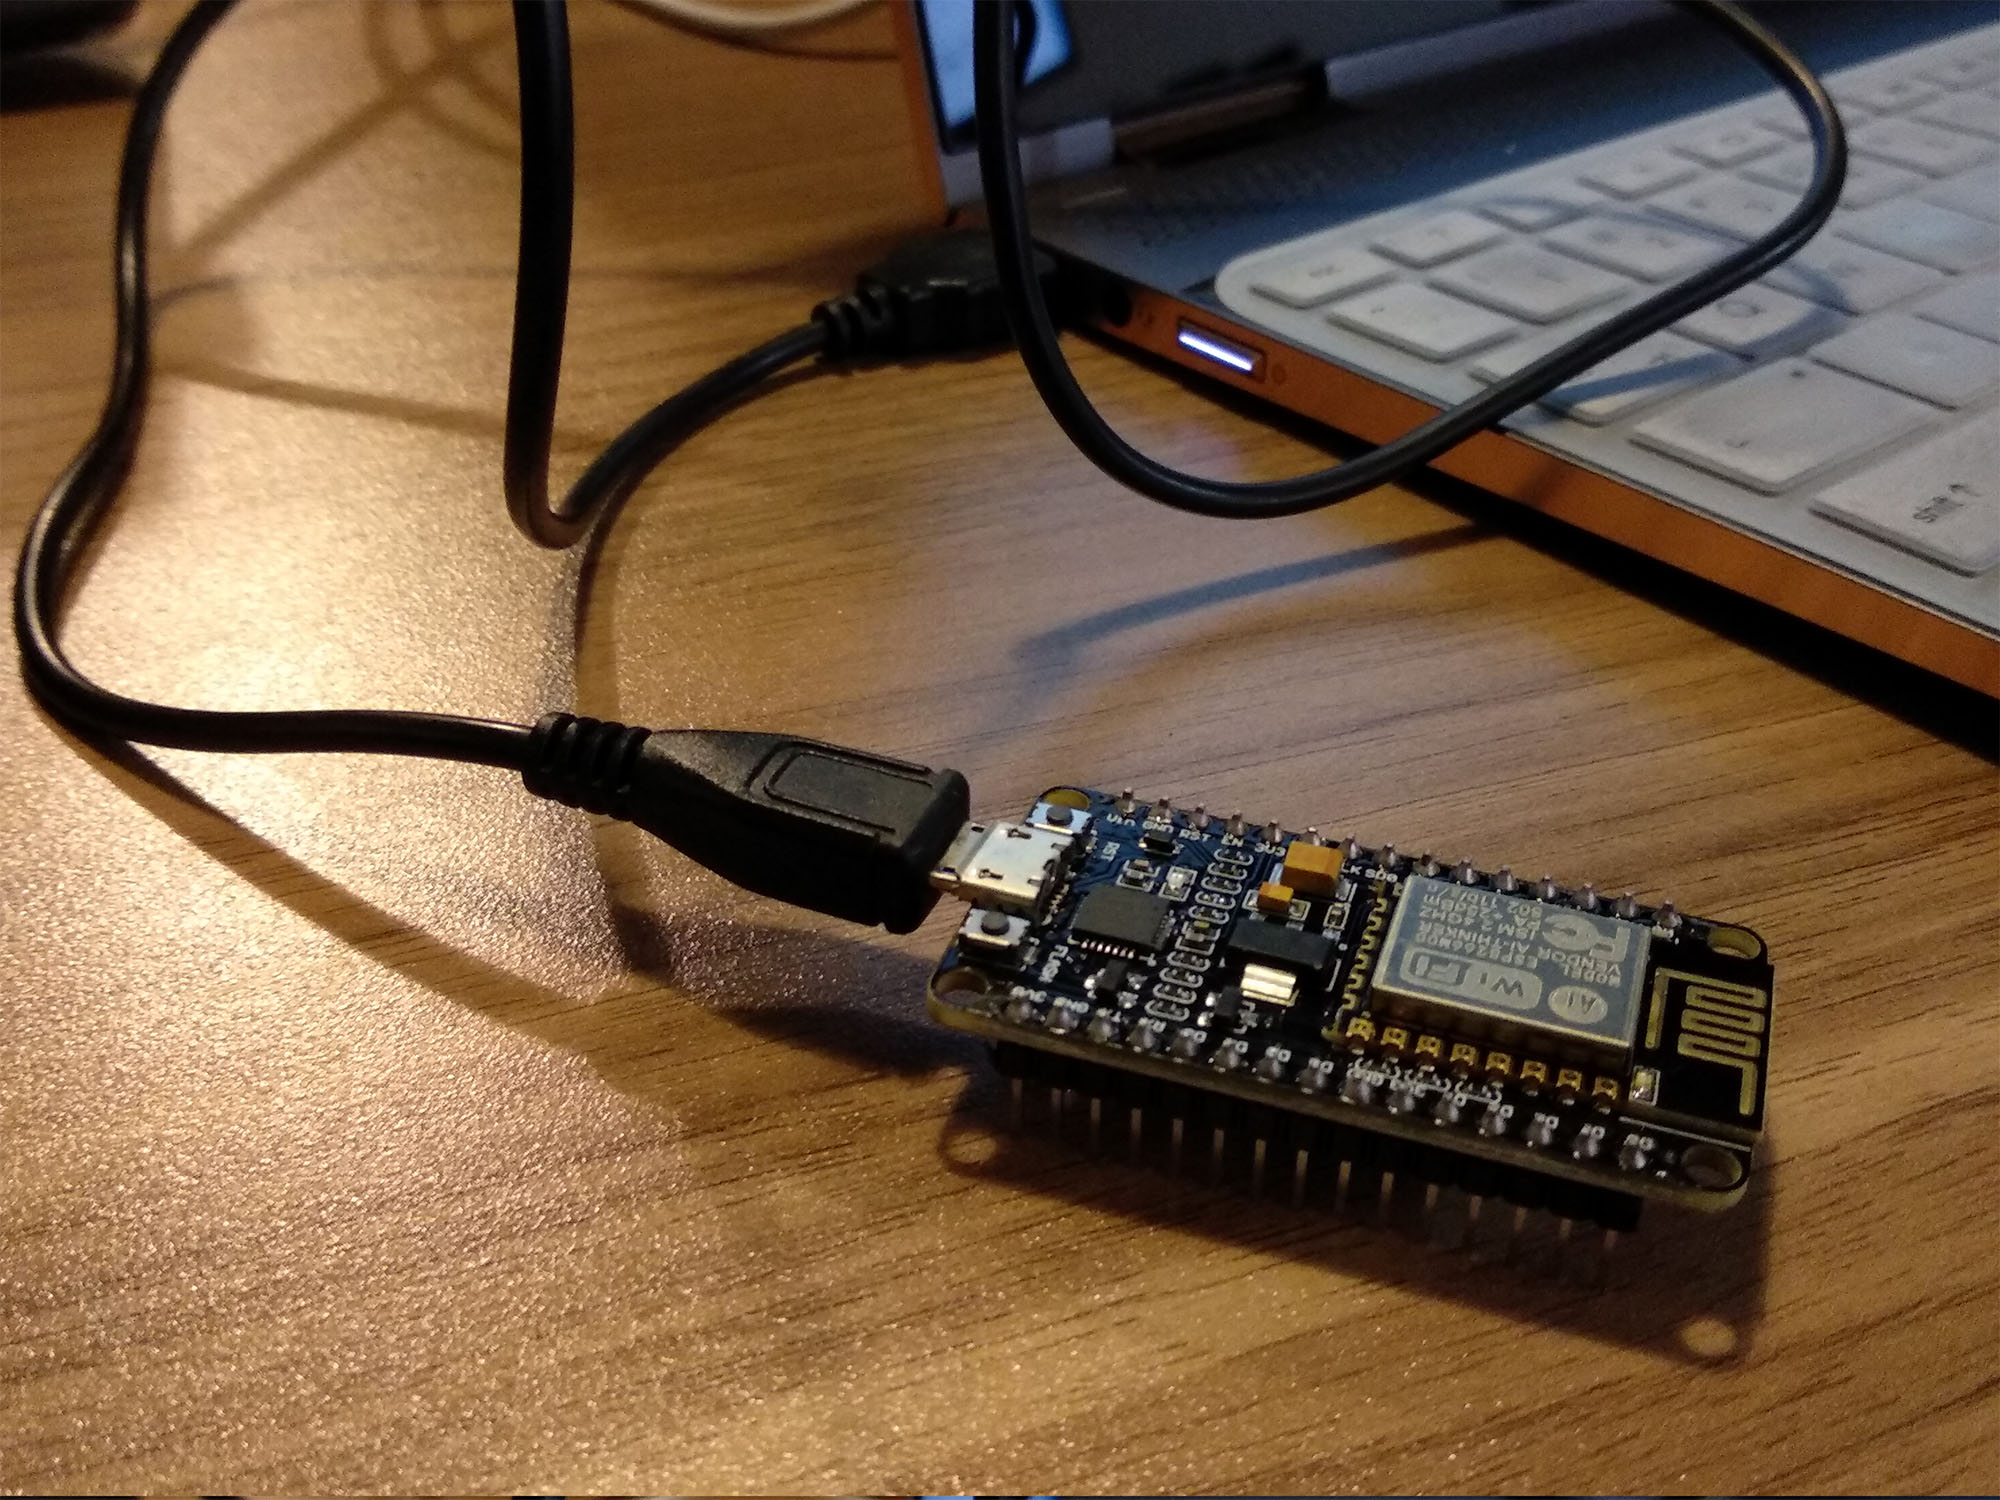
Using the shorter ( < 1m) Flat Micro USB Cable, connect the Arduino to your computer.
Open a terminal/bash & enter the hidden file directory below:
cd ~/.arduino15/packages/esp8266/tools/esptool/0.4.9
Once in the directory, install esptool, the bootloader software:
pip install esptool
 Reference documentation on esptool: https://github.com/espressif/esptool/blob/master/README.md
⚠️ Hidden Files?
Hidden files and folders (whose naming convention starts with ".", such as ".arduino15" in this instance) do not appear while manually browsing or exploring folders, usually to prevent users from deleting sensitive or confidential data. In this case we are making a clear exception as we know which specific file to modify. To show and hide hidden files in Linux, justctrl + H
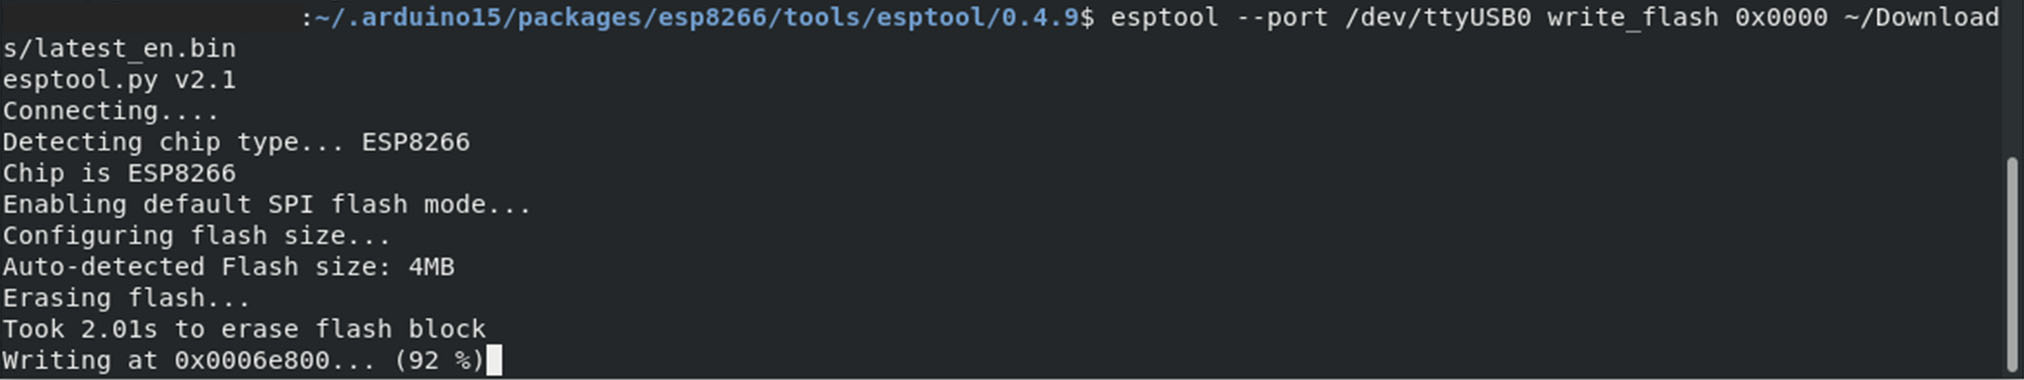
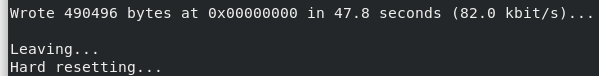
Run the command to flash the firmware on Arduino 
esptool --port/dev/ttyUSB0
write_flash 0x0000 ~/Downloads/latest_en.bin
/dev/ttyUSB0
: Open the ArduinoIDE, "Tools -> Port", then "Tools > Get board info" to verify that the board is connected to the correct USB port;~/Downloads/latest_en.bin
: Make sure to write the correct directory path to the firmware.⚠️ IF YOU GET ERROR: [Errno 13]
[Errno 13] could not open port /dev/ttyUSB0: [Errno 13] Permission denied: '/dev/ttyUSB0
Change permission privileges with:
sudo chmod 666 /dev/ttyUSB0

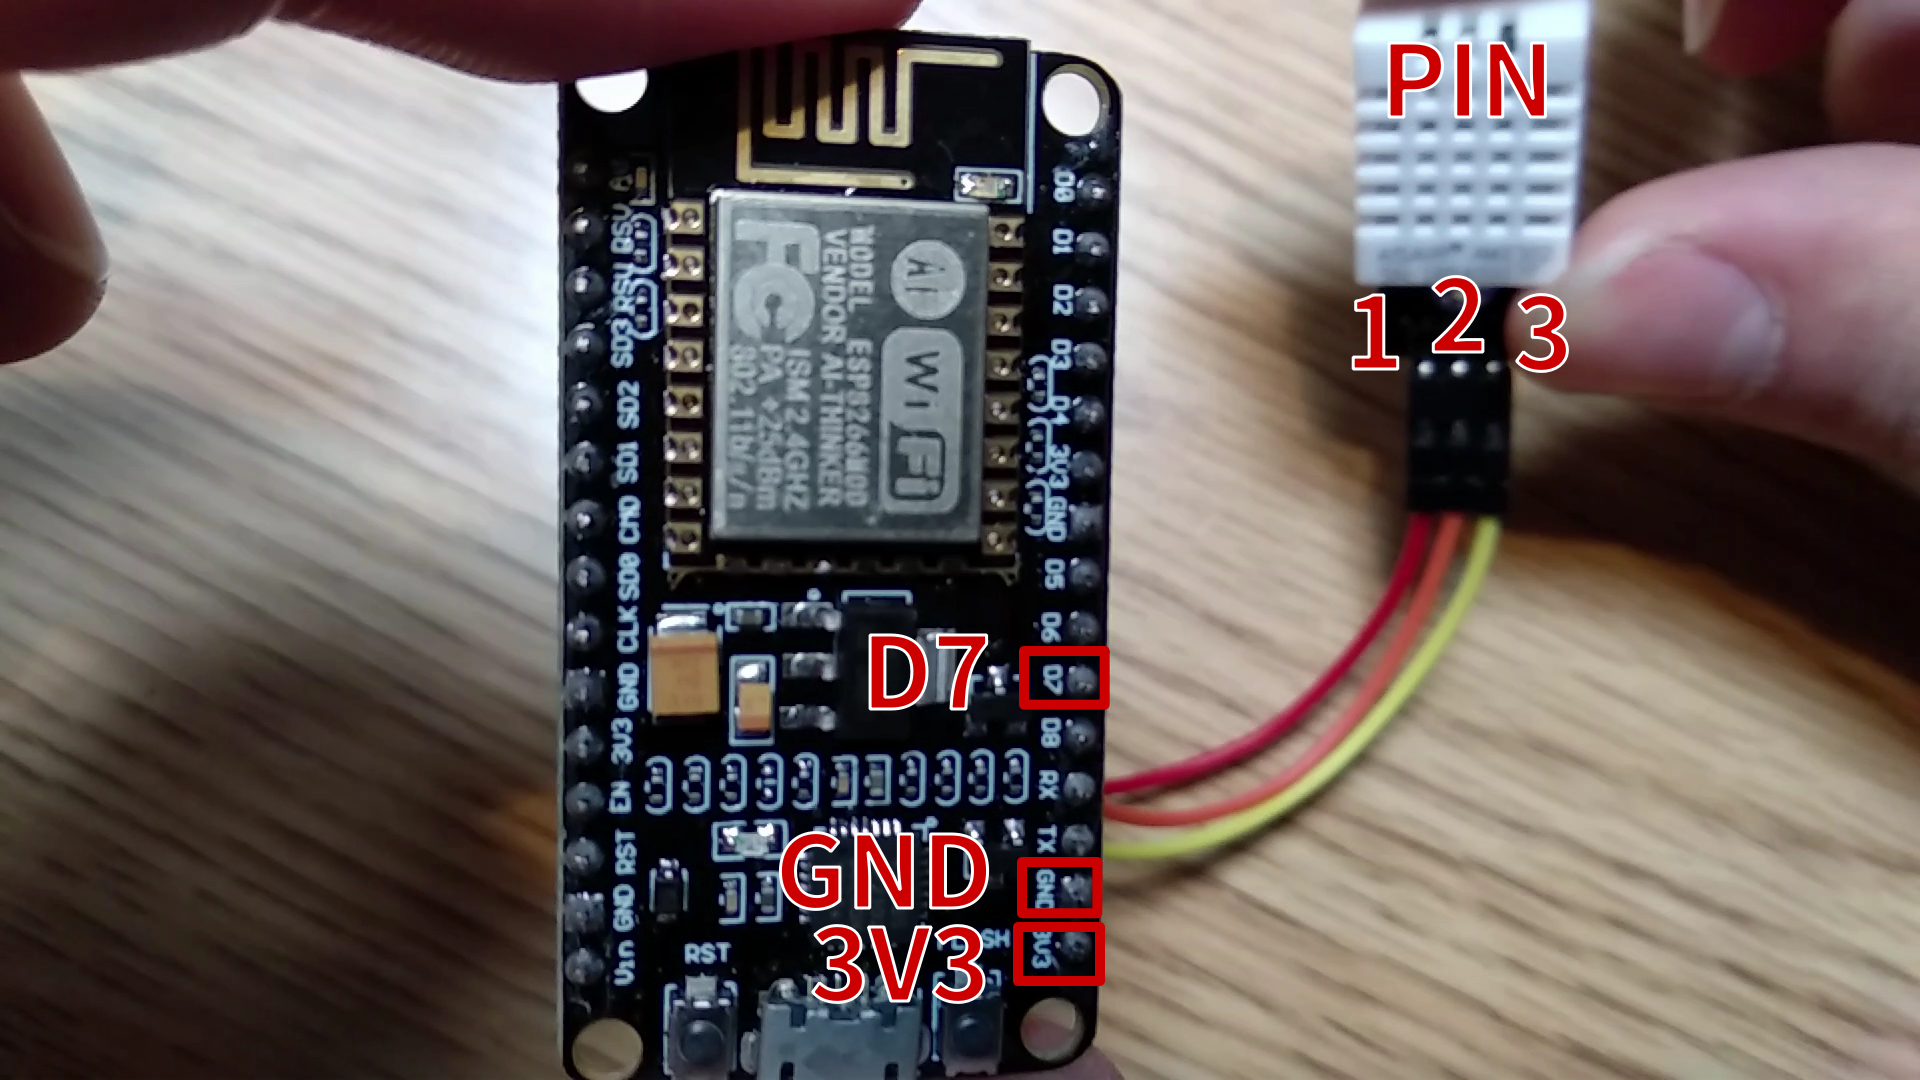
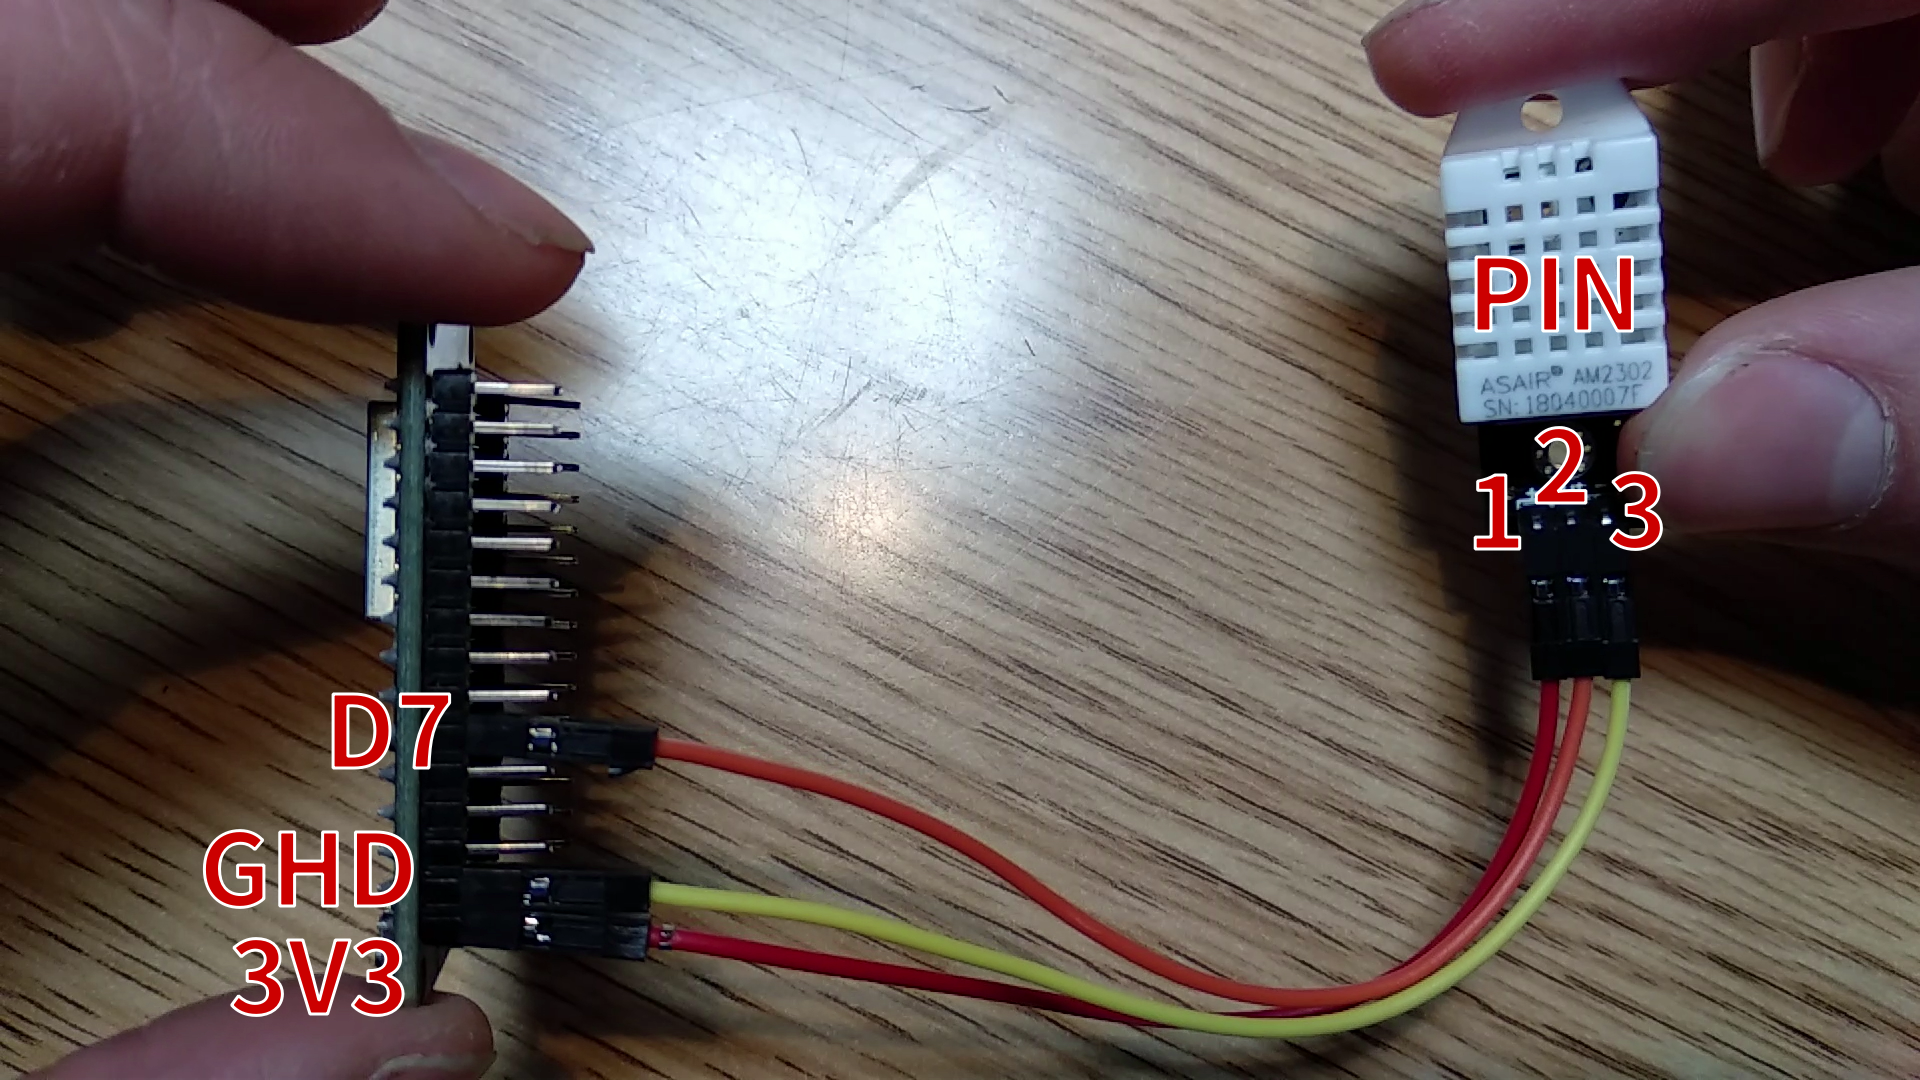
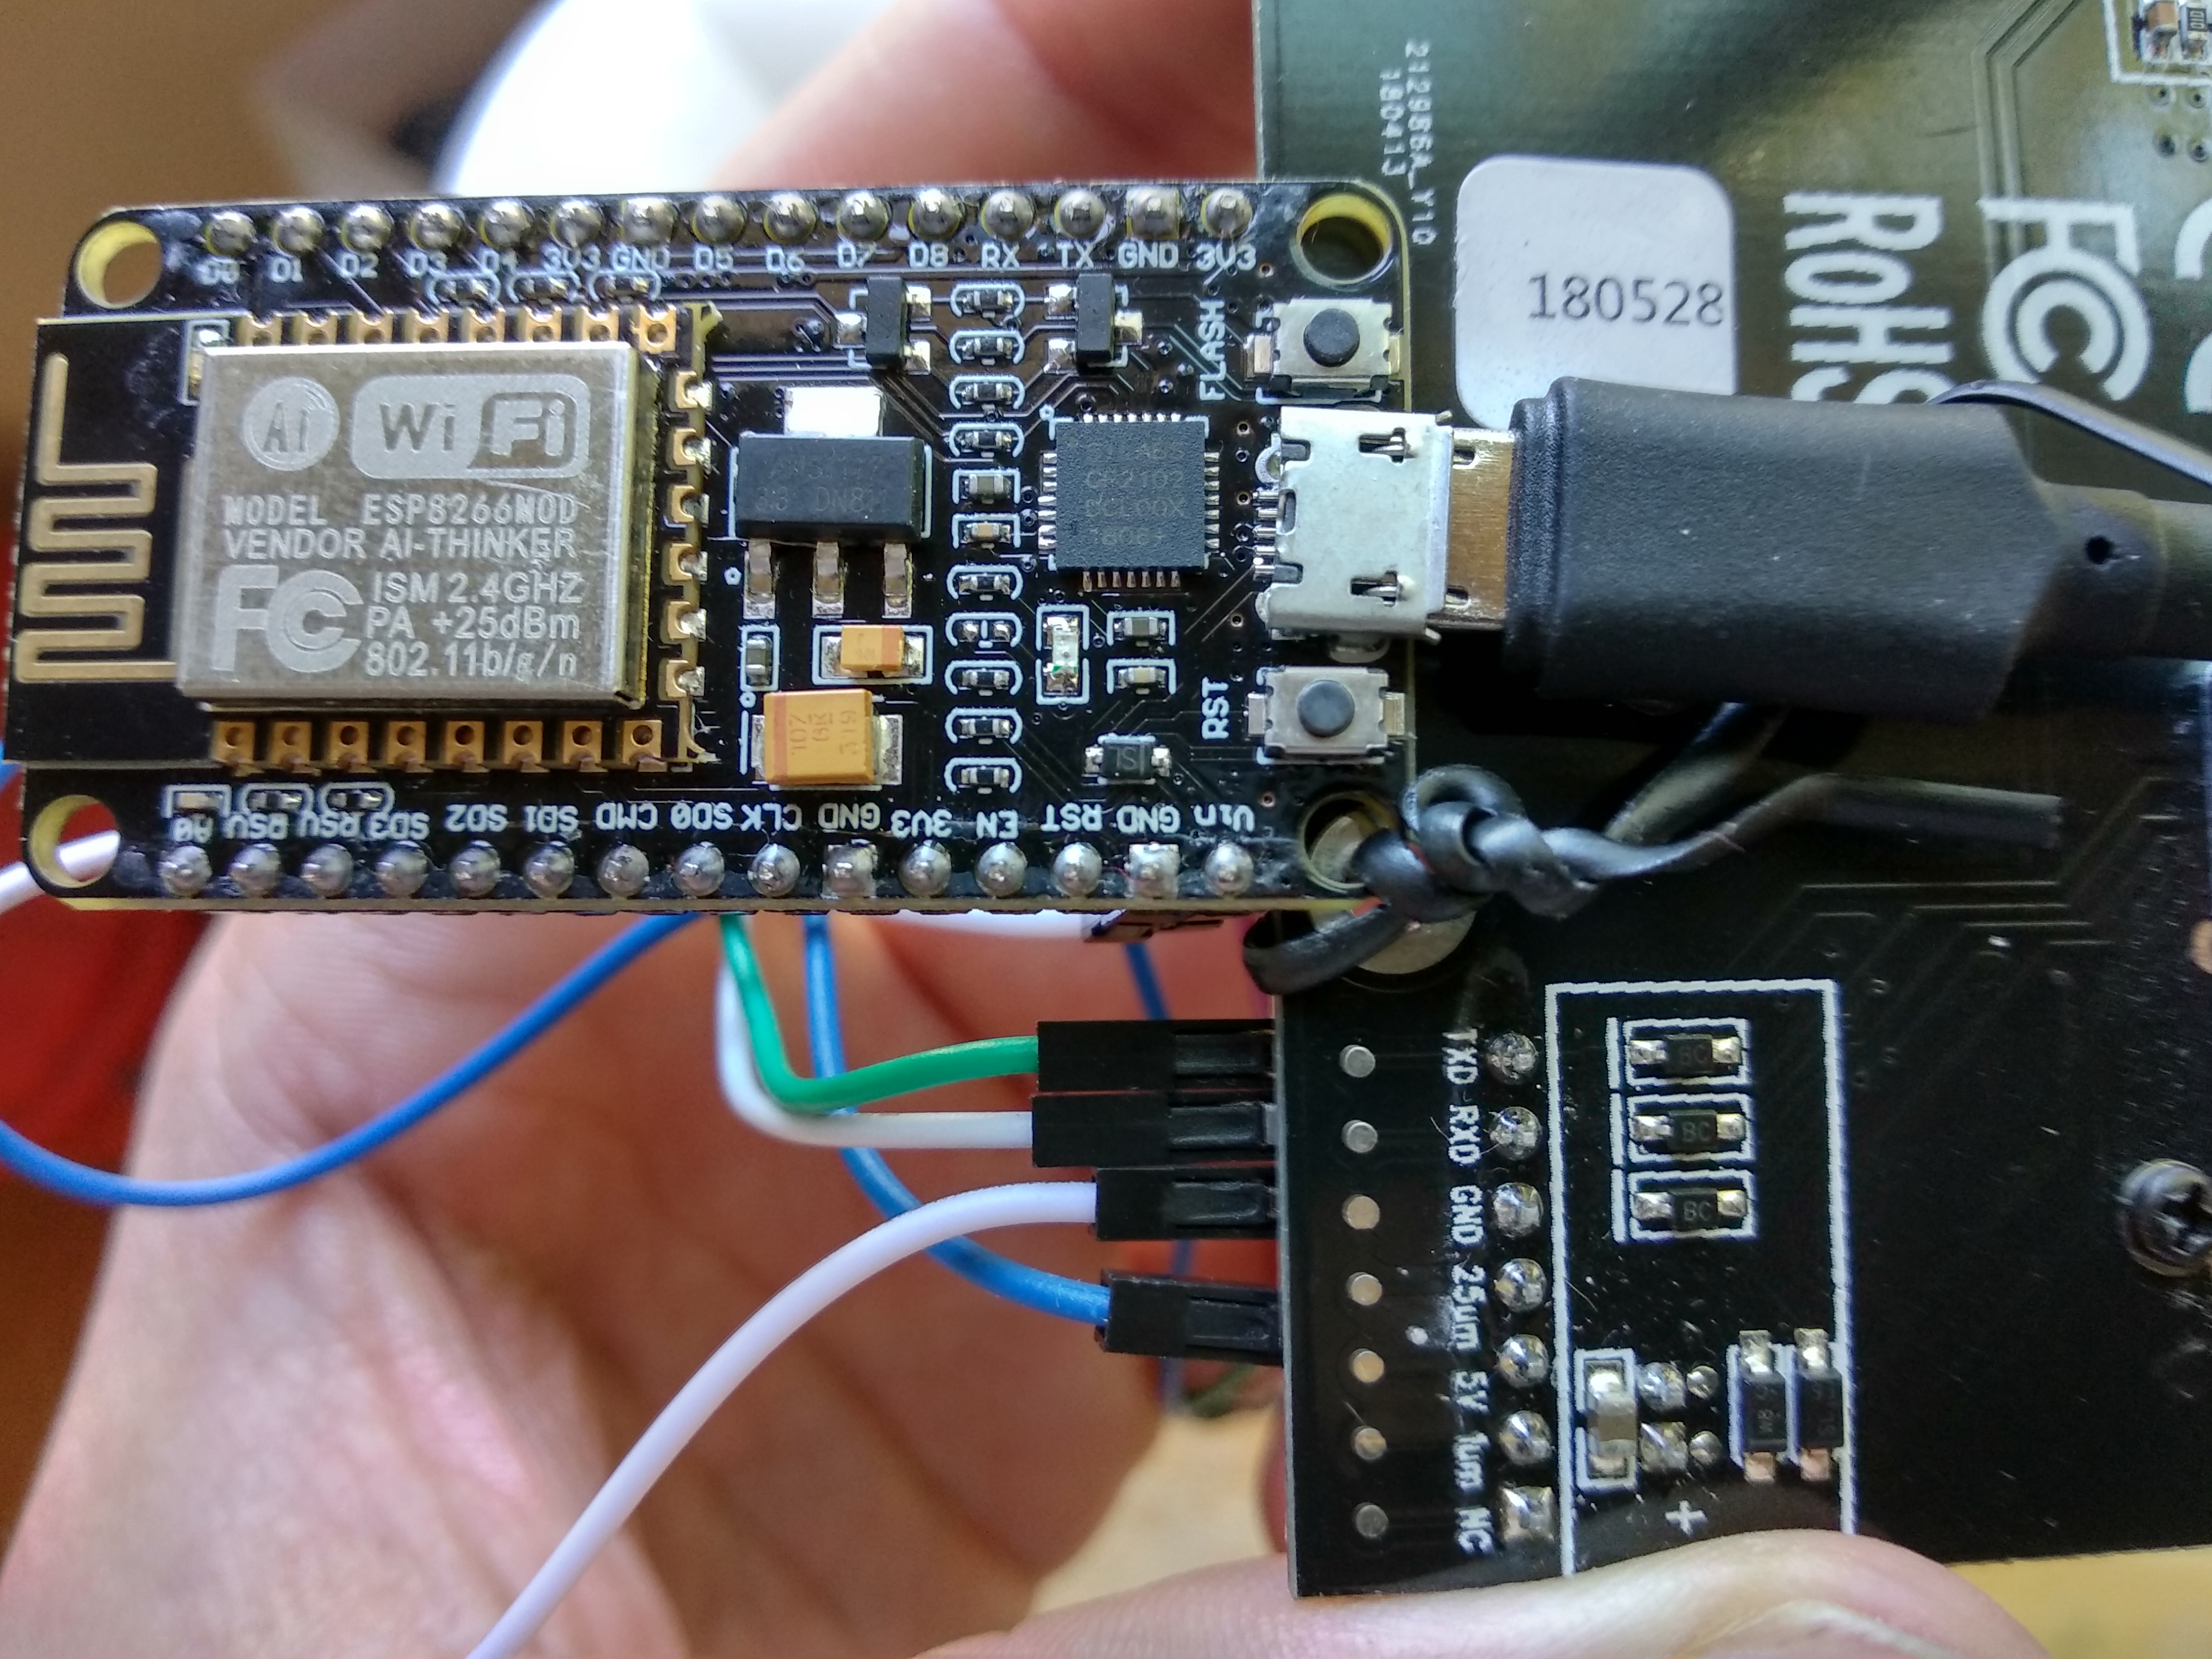
Task 2: Assembly Required 
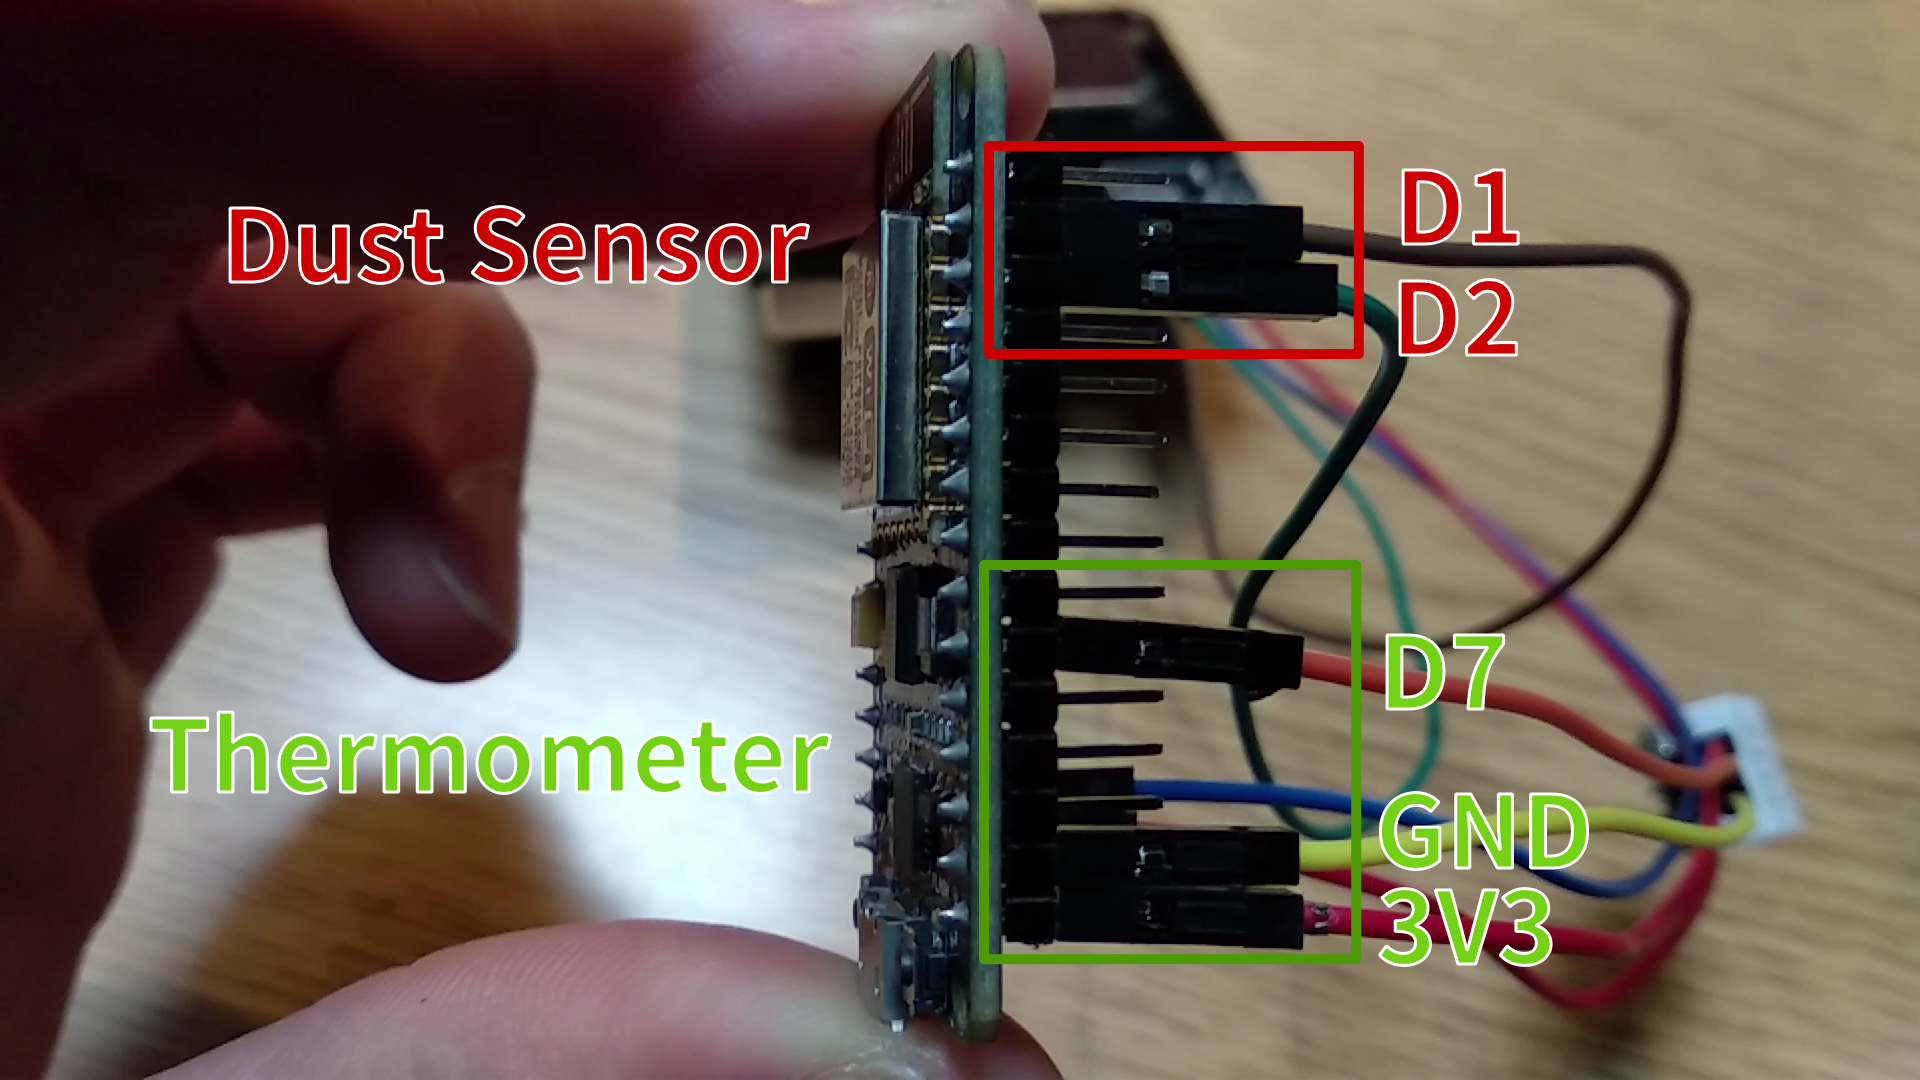
We will follow the schema below as our guide to connect the components 
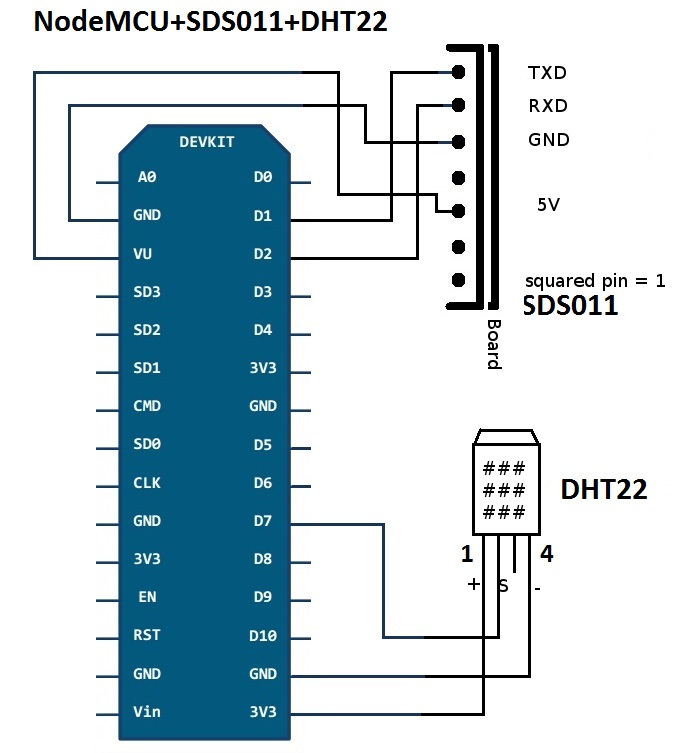
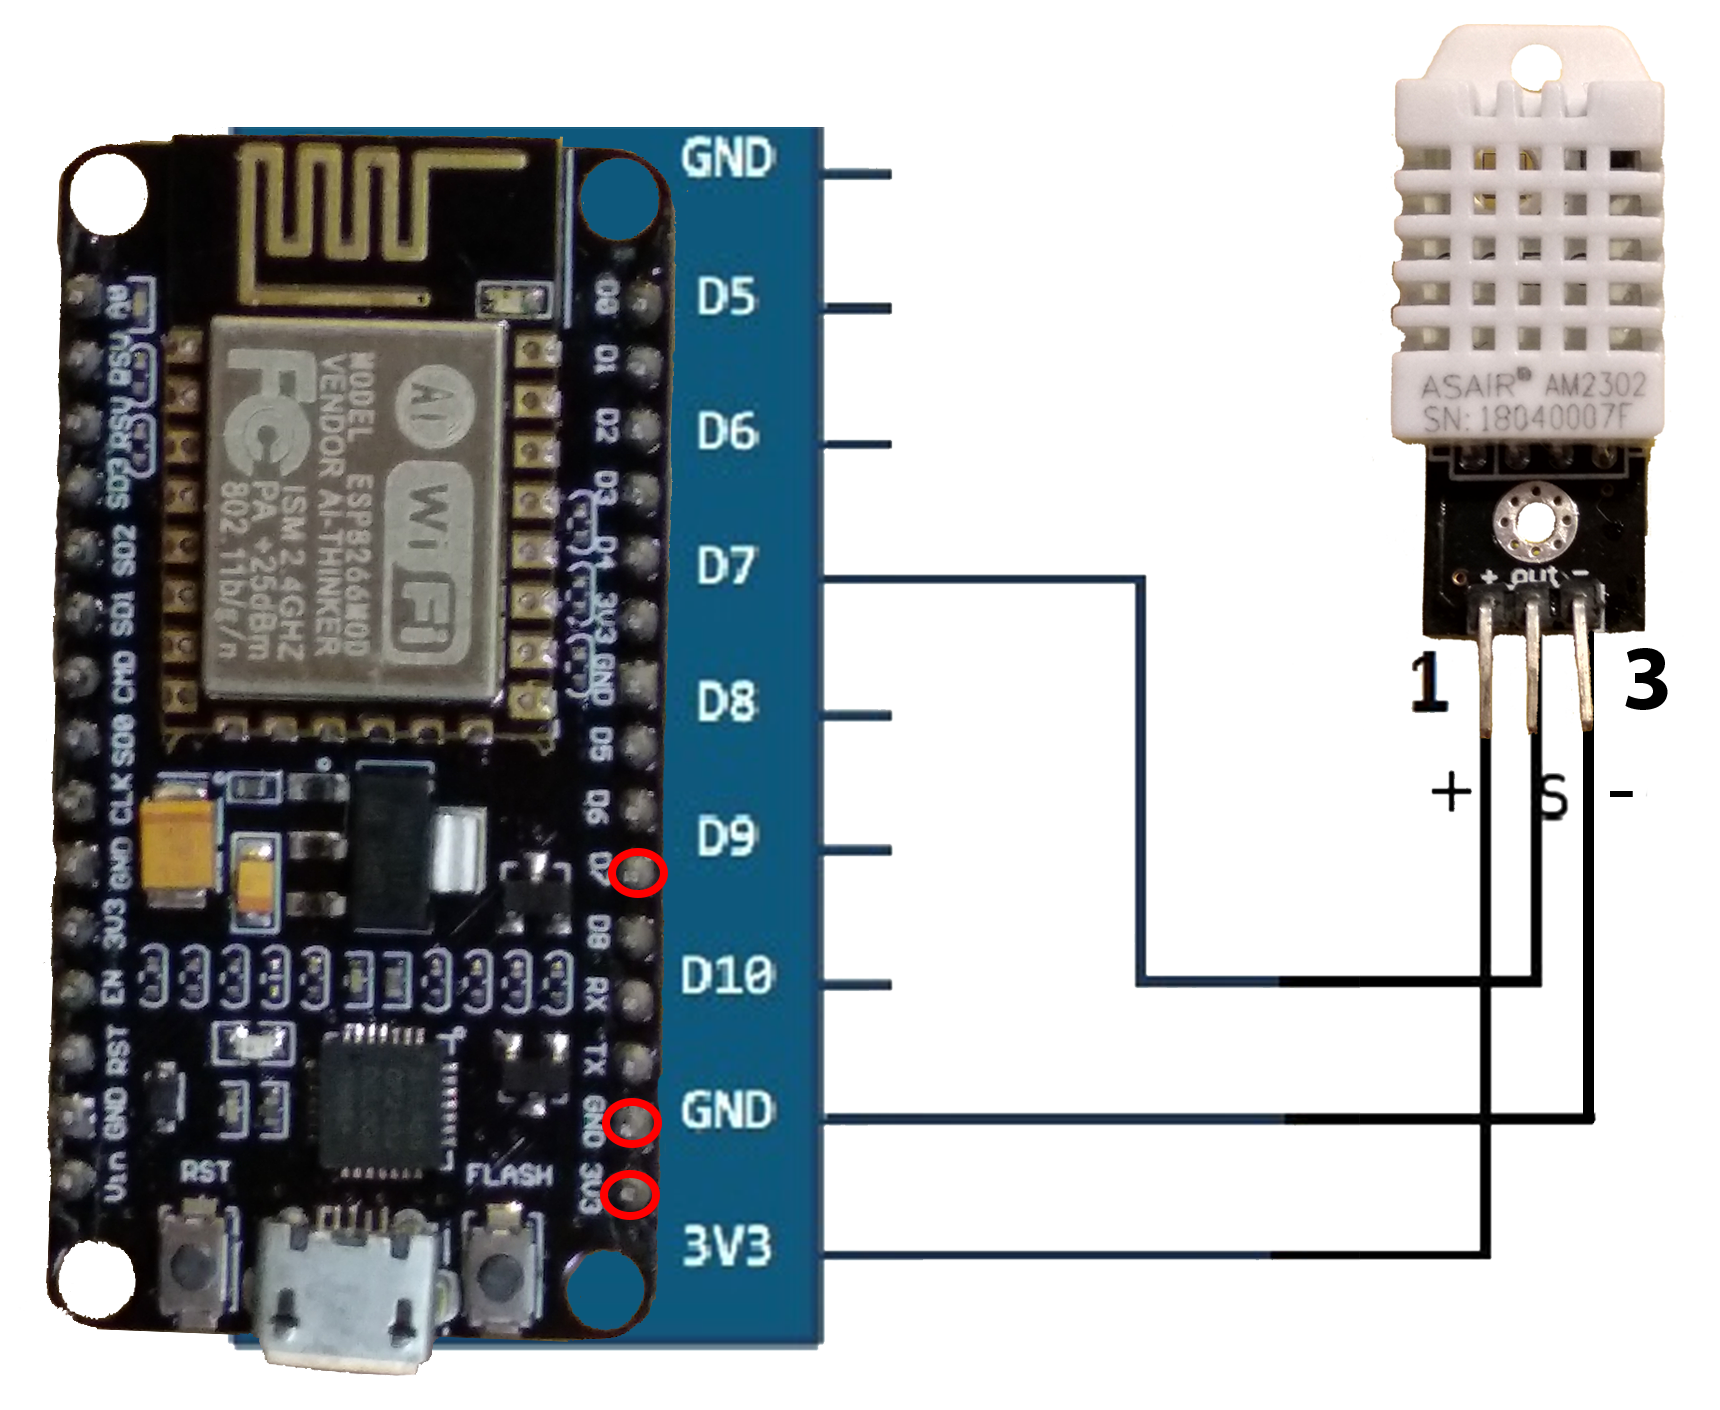
Connect Pin 1 to 3V3 
Connect Pin 2 to D7 
Connect Pin 3 to GND 
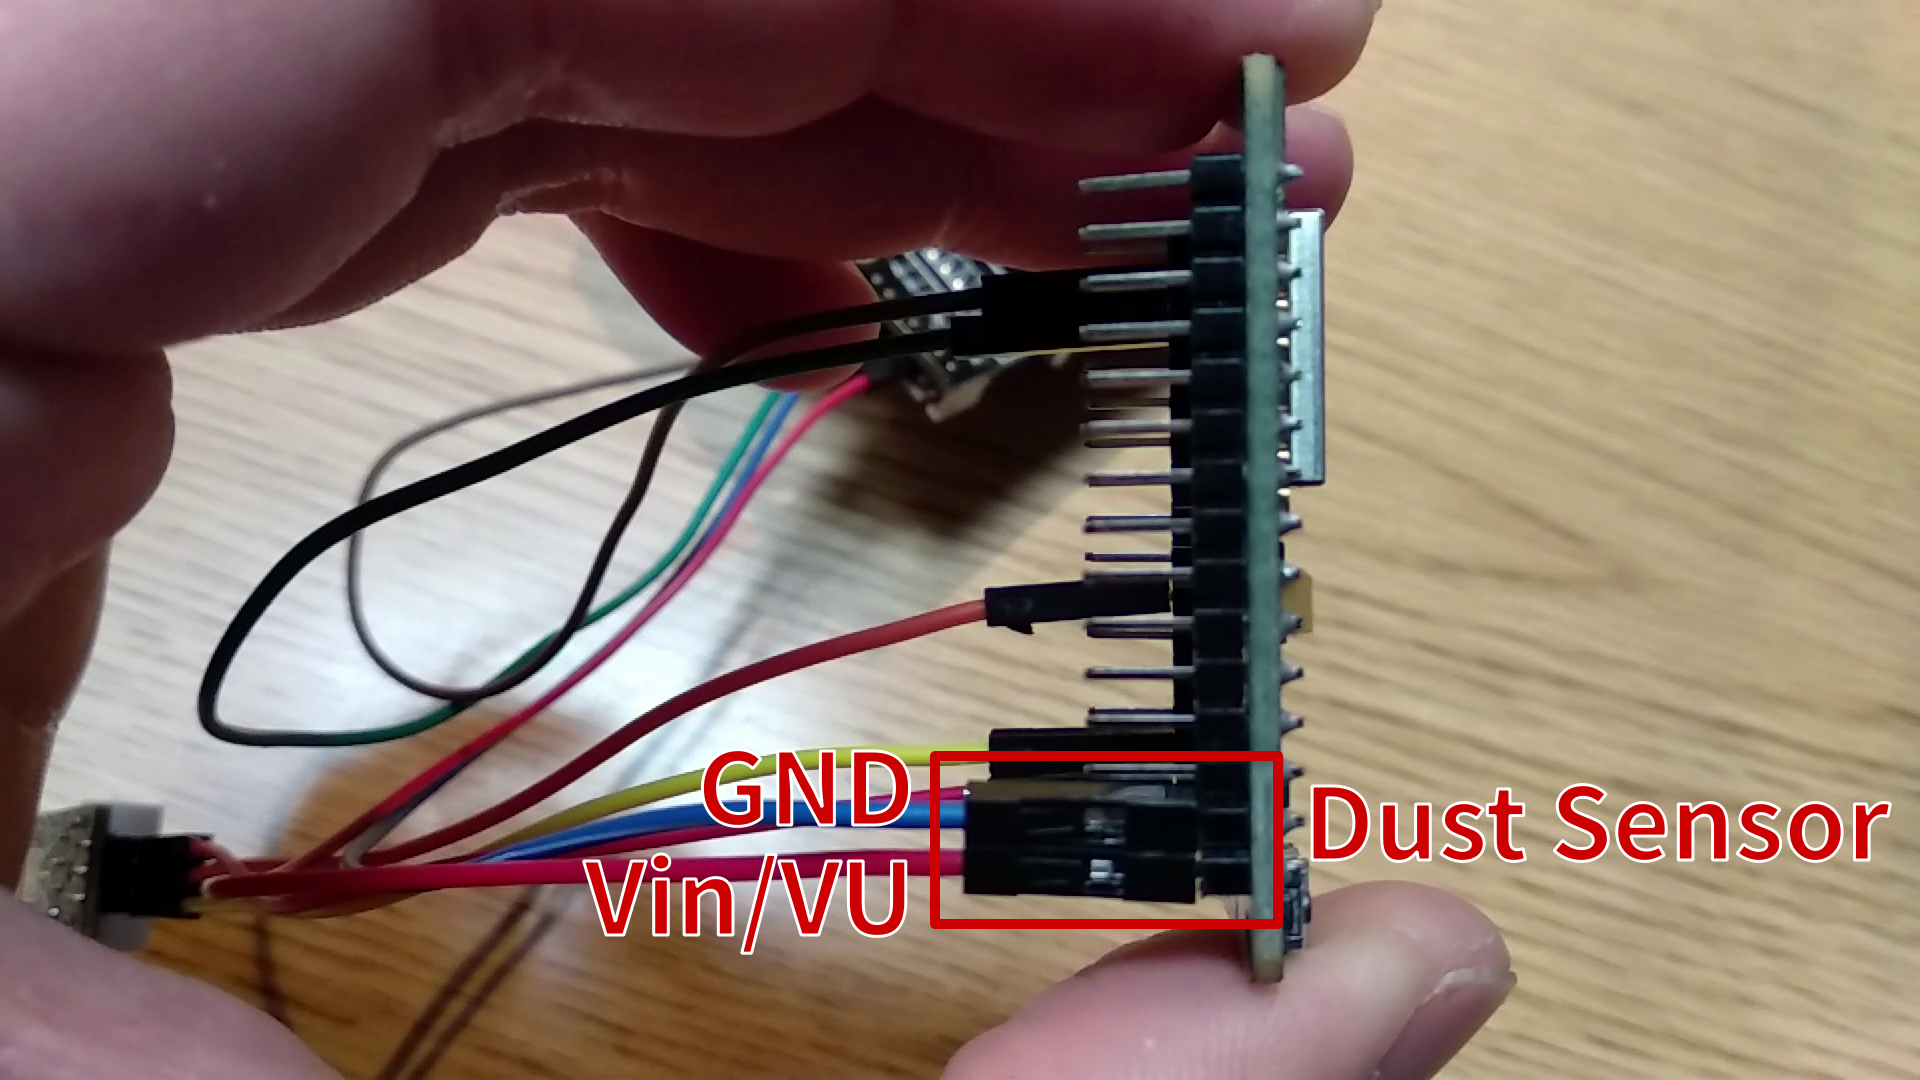
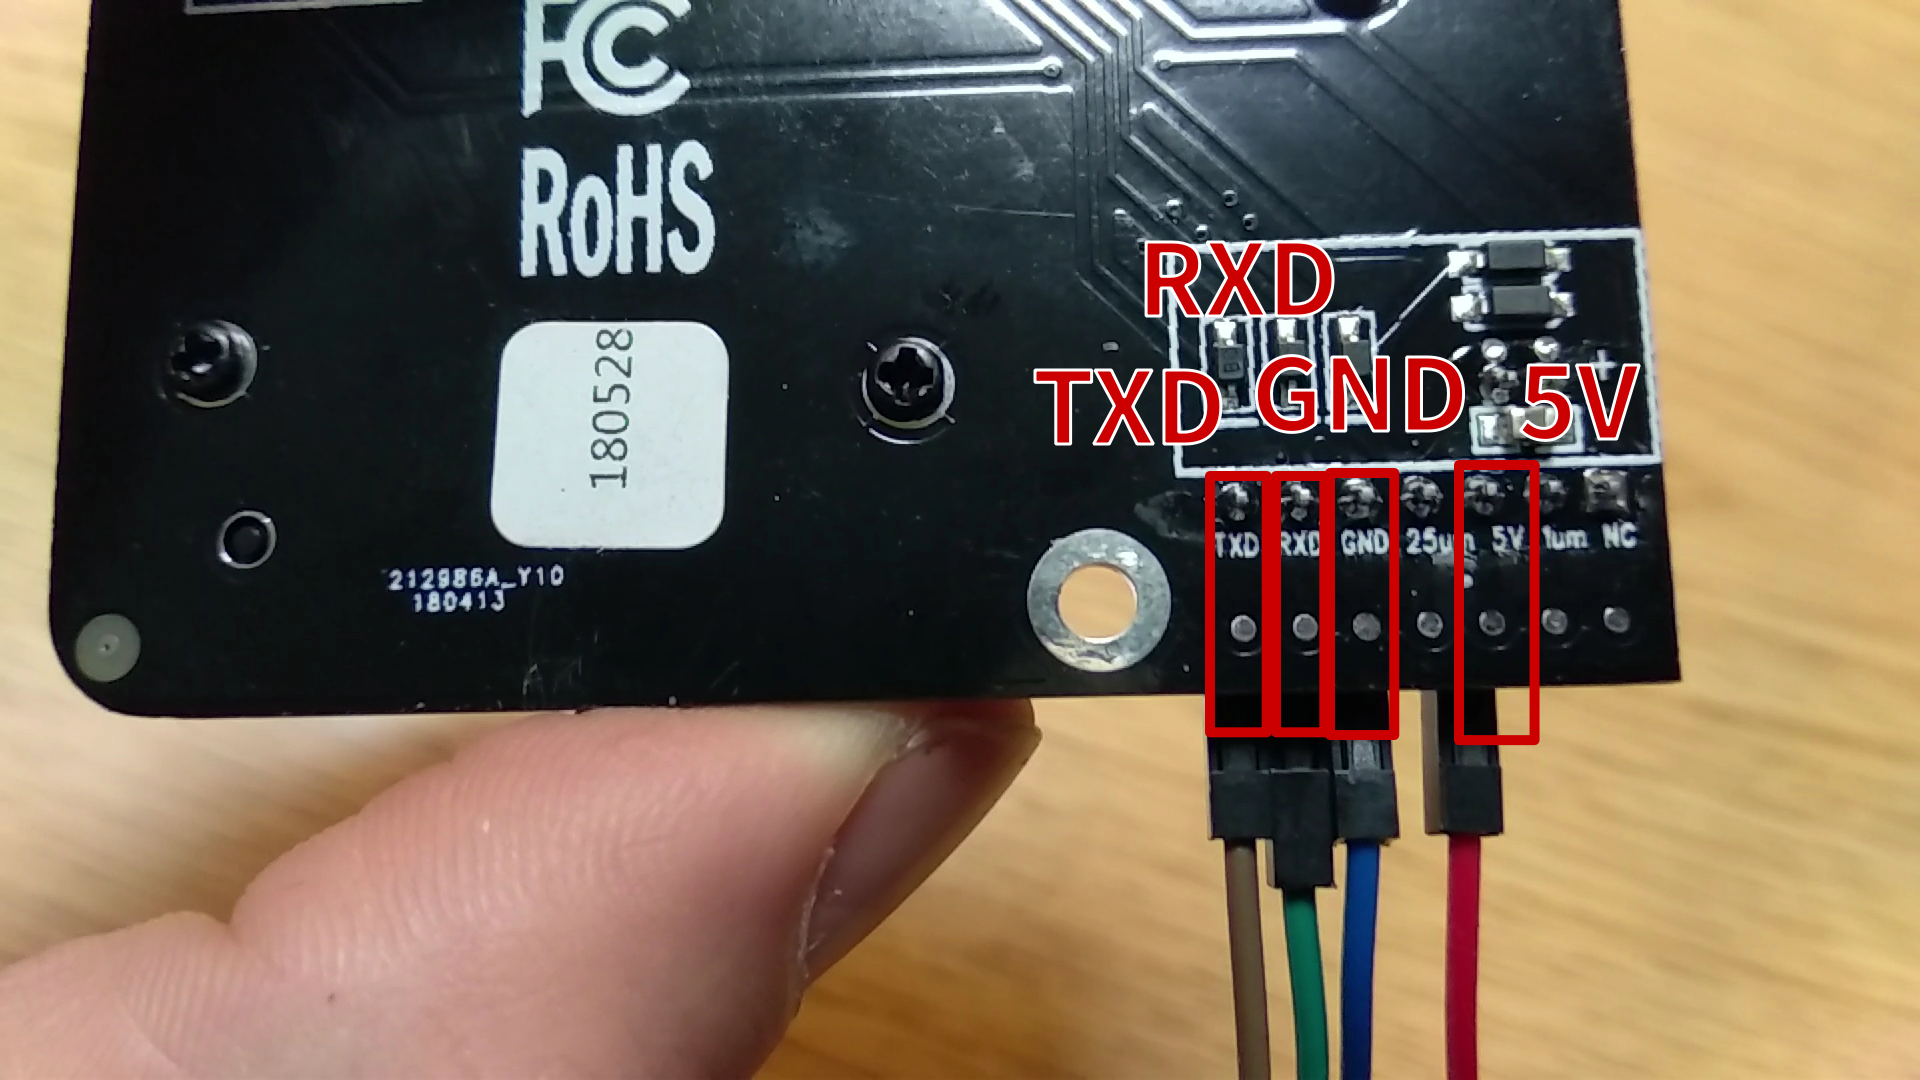
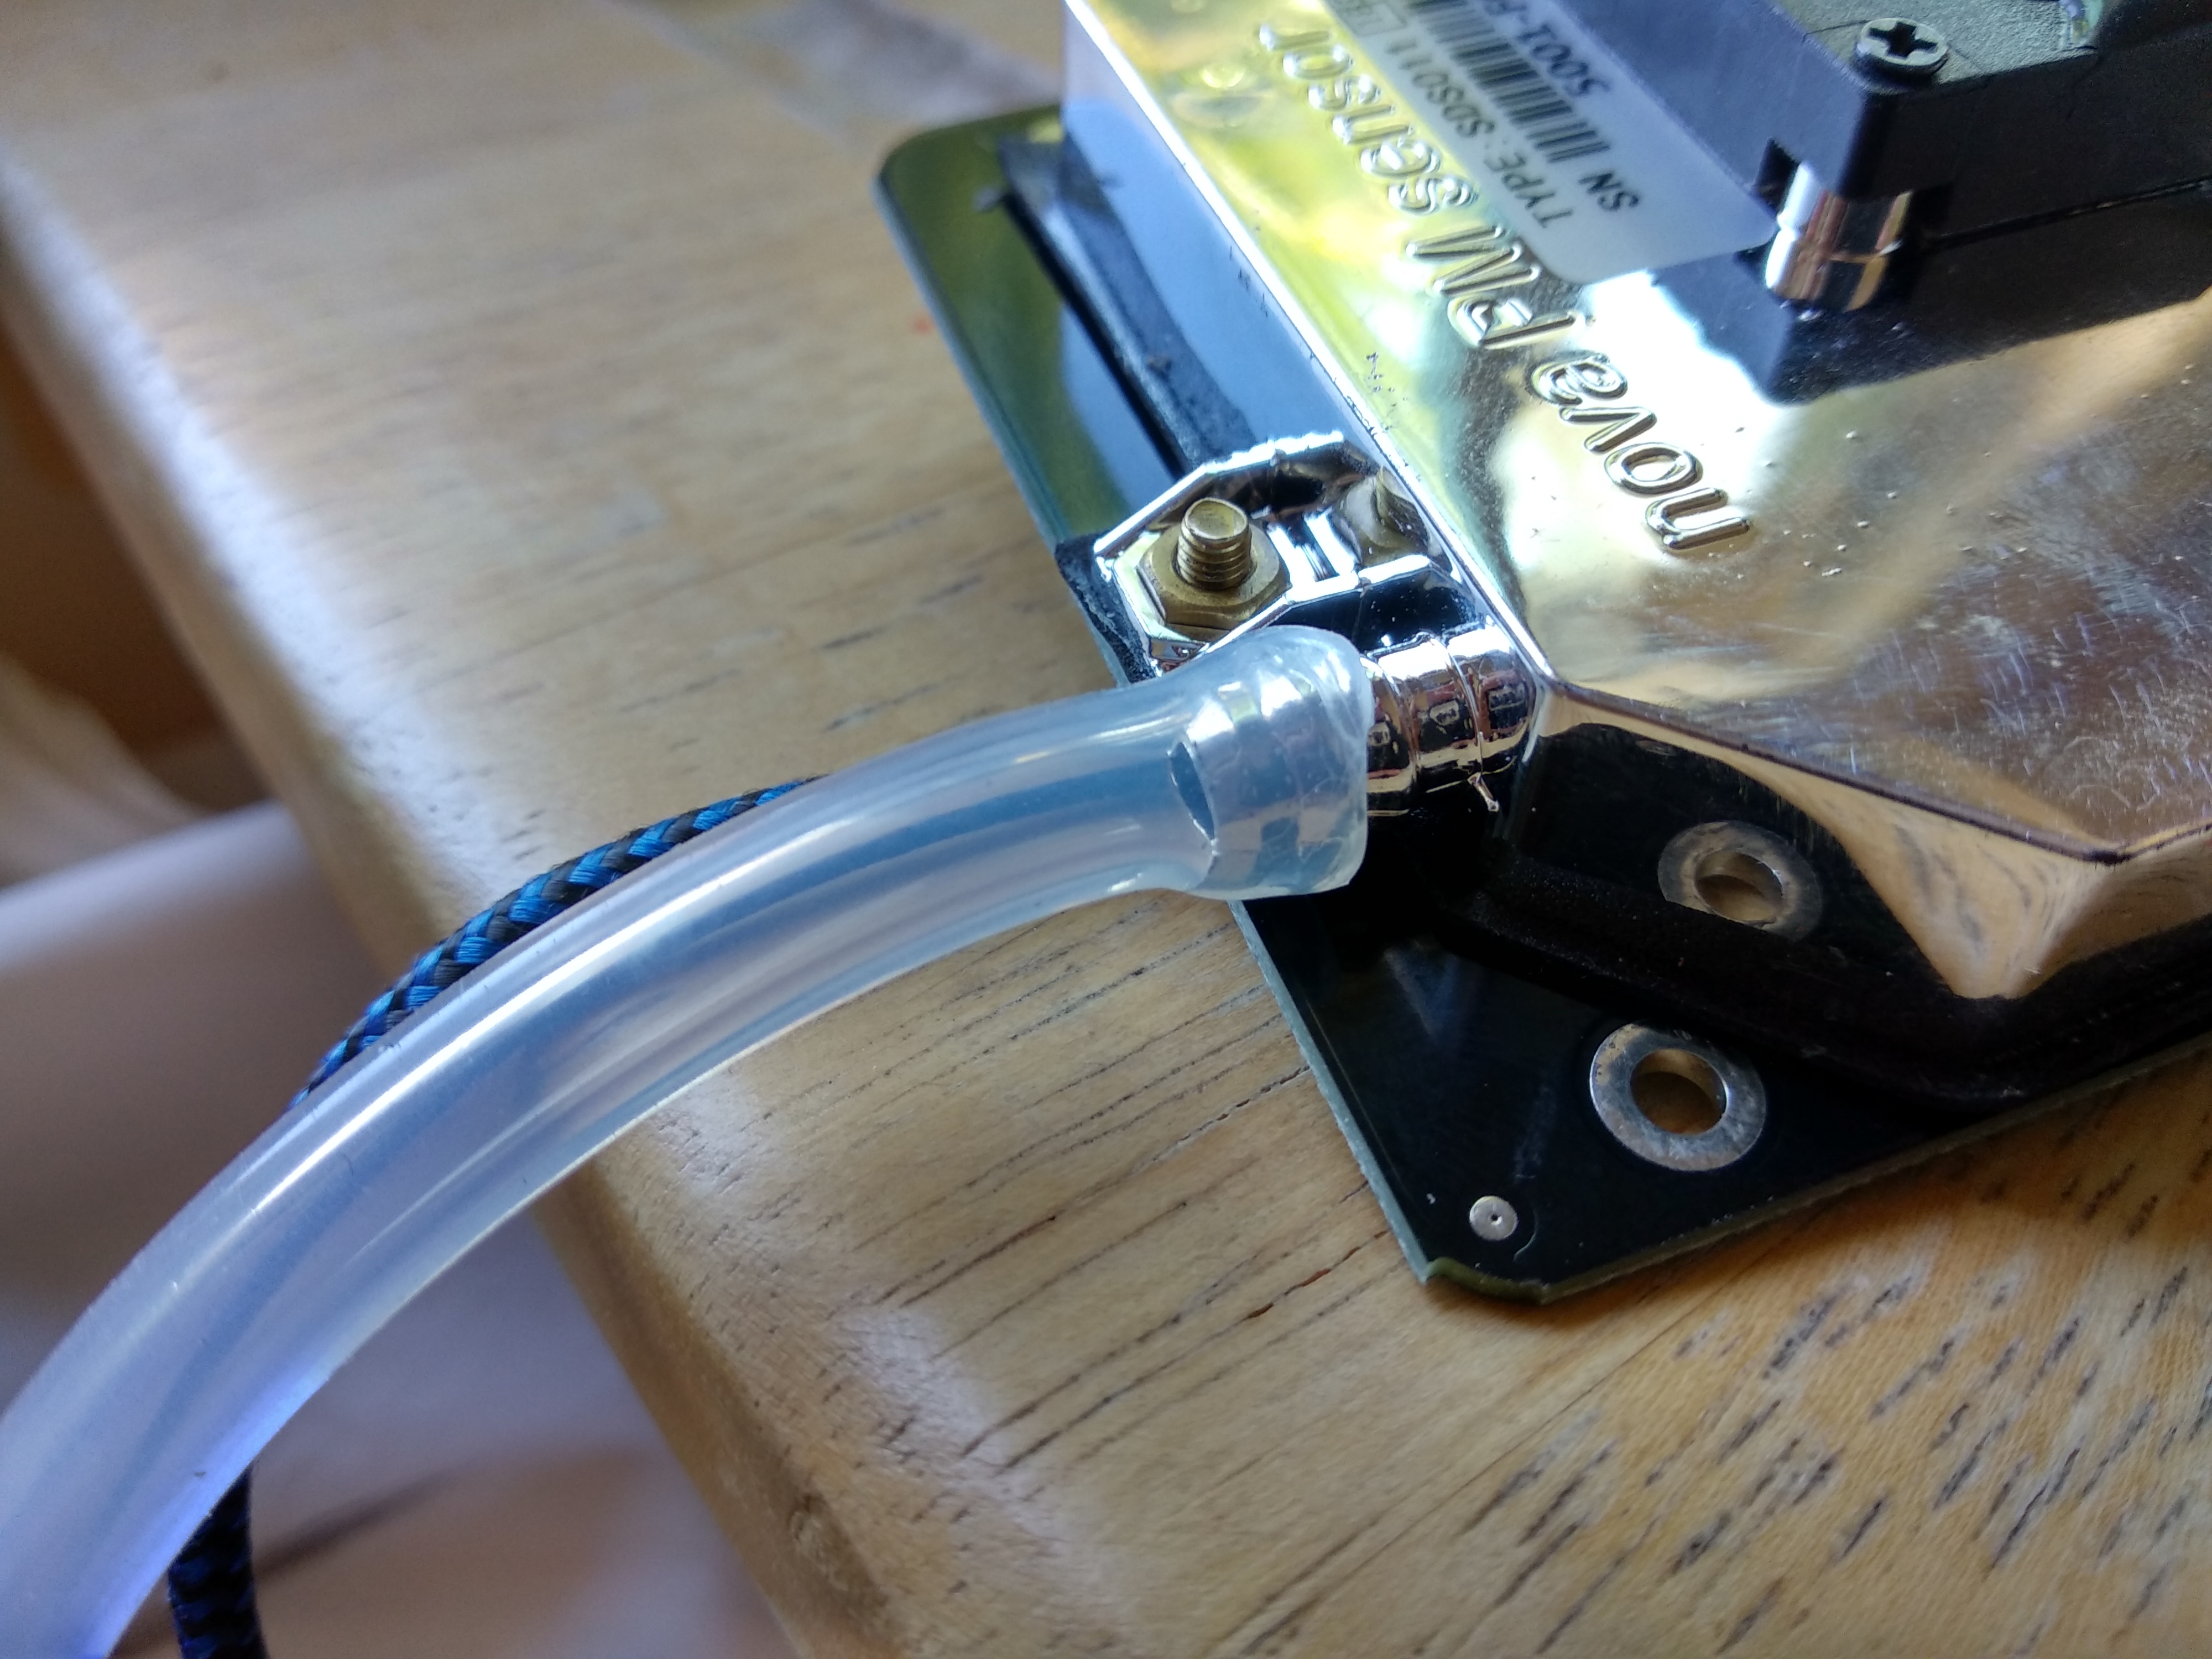
2.2 Connect the Dust Sensor to the Board* 
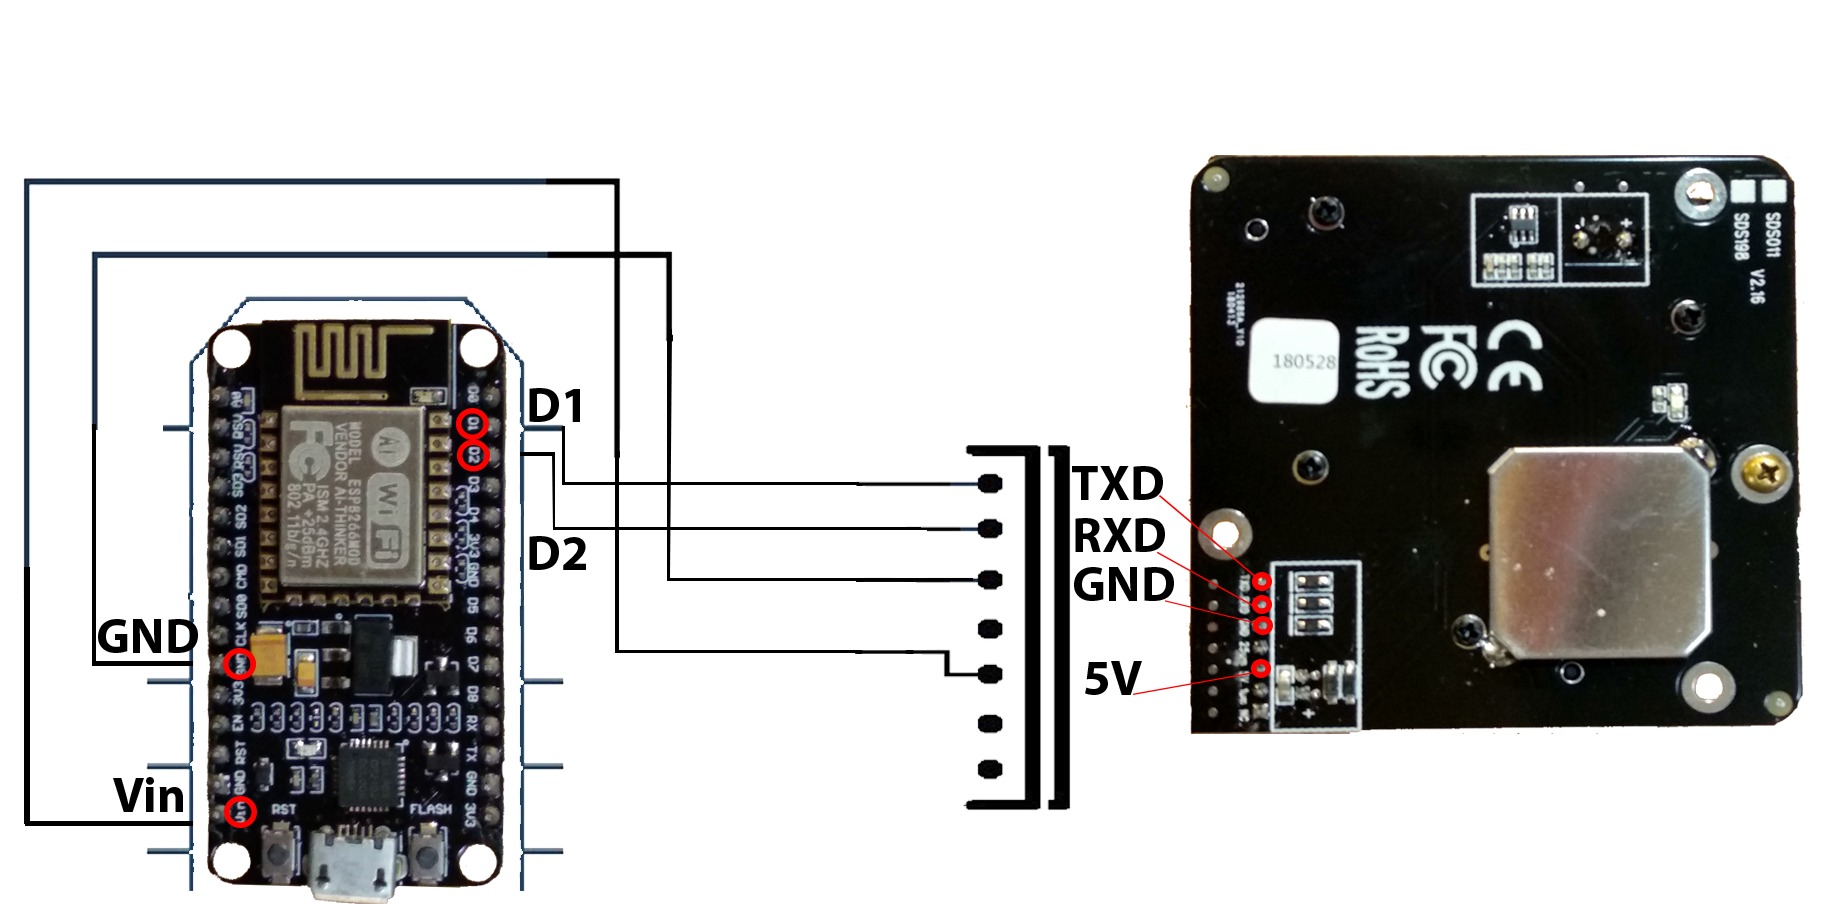
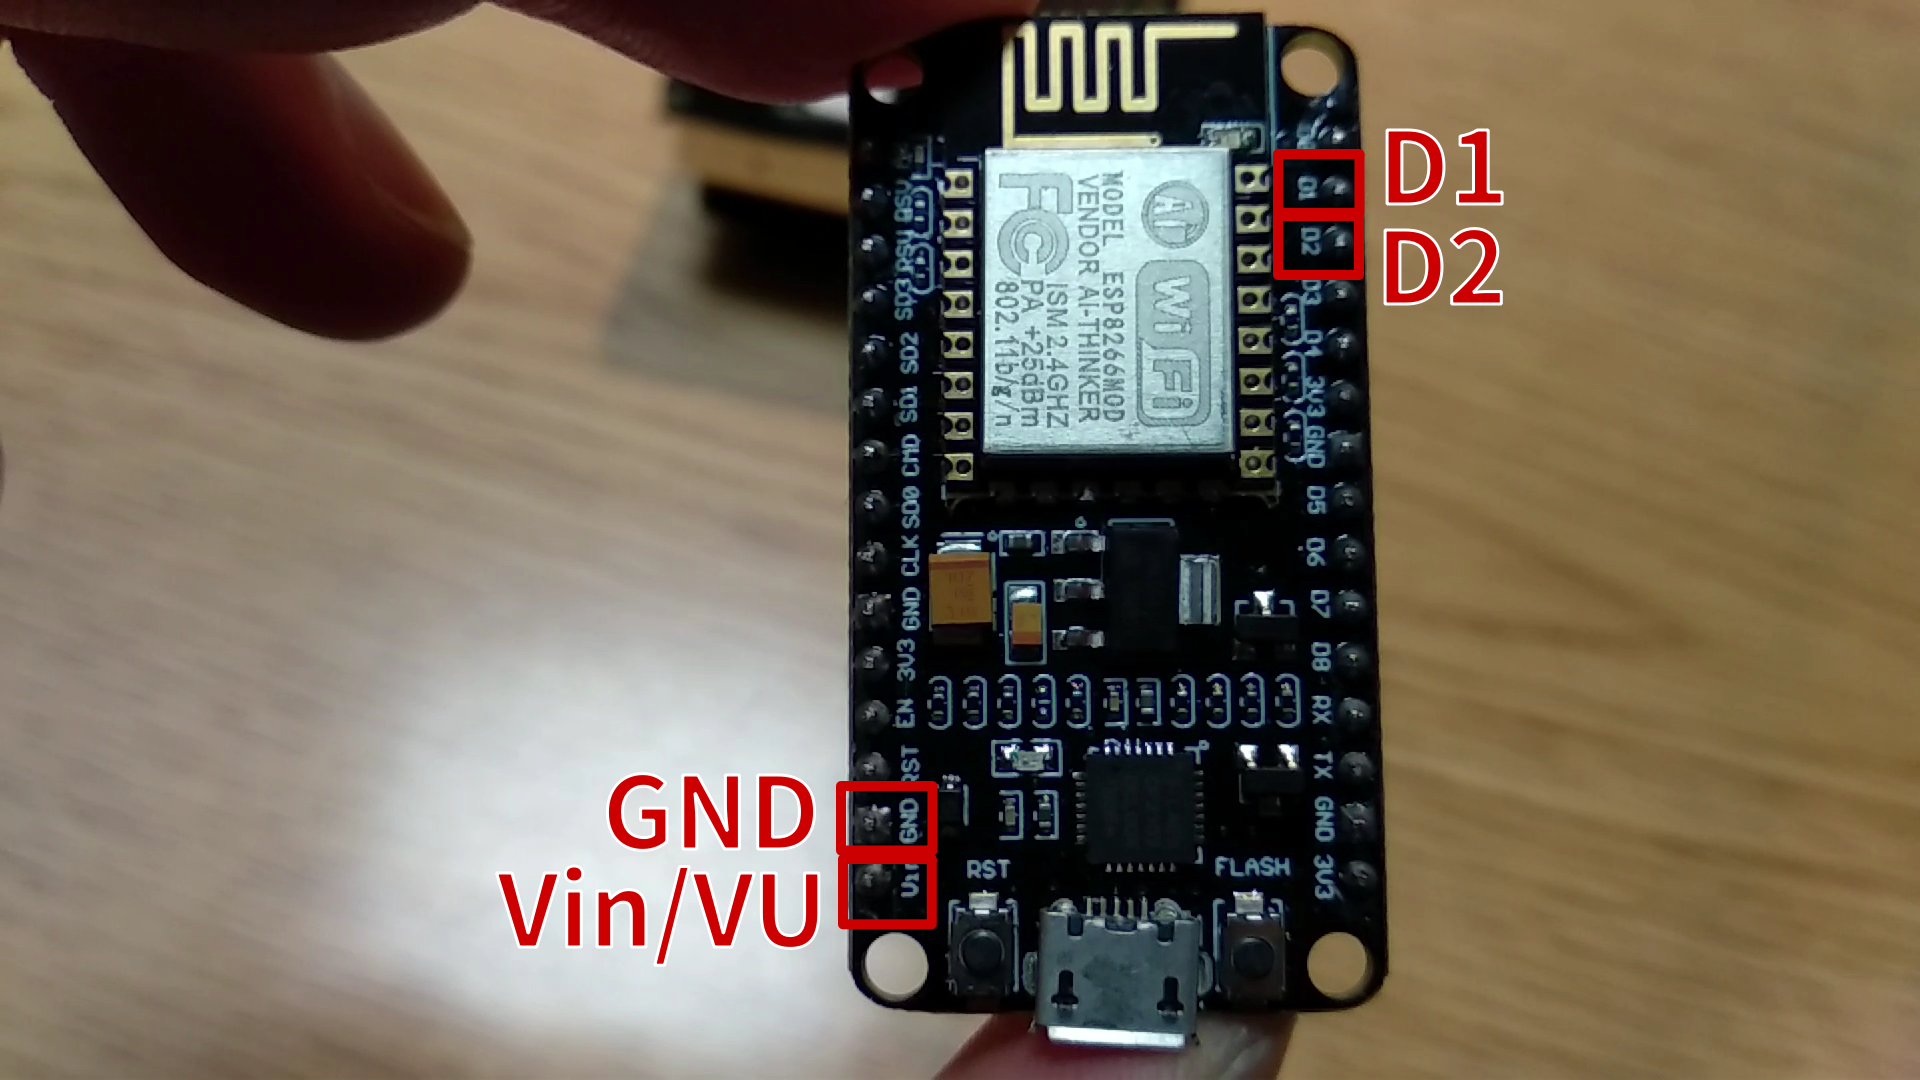
Connect 5V to Vin/VU 
Connect GND to GND 
Connect RXD to D2 

Connect TXD to D1 
End Result 
Great, you now have all of the essential hardware connected! 

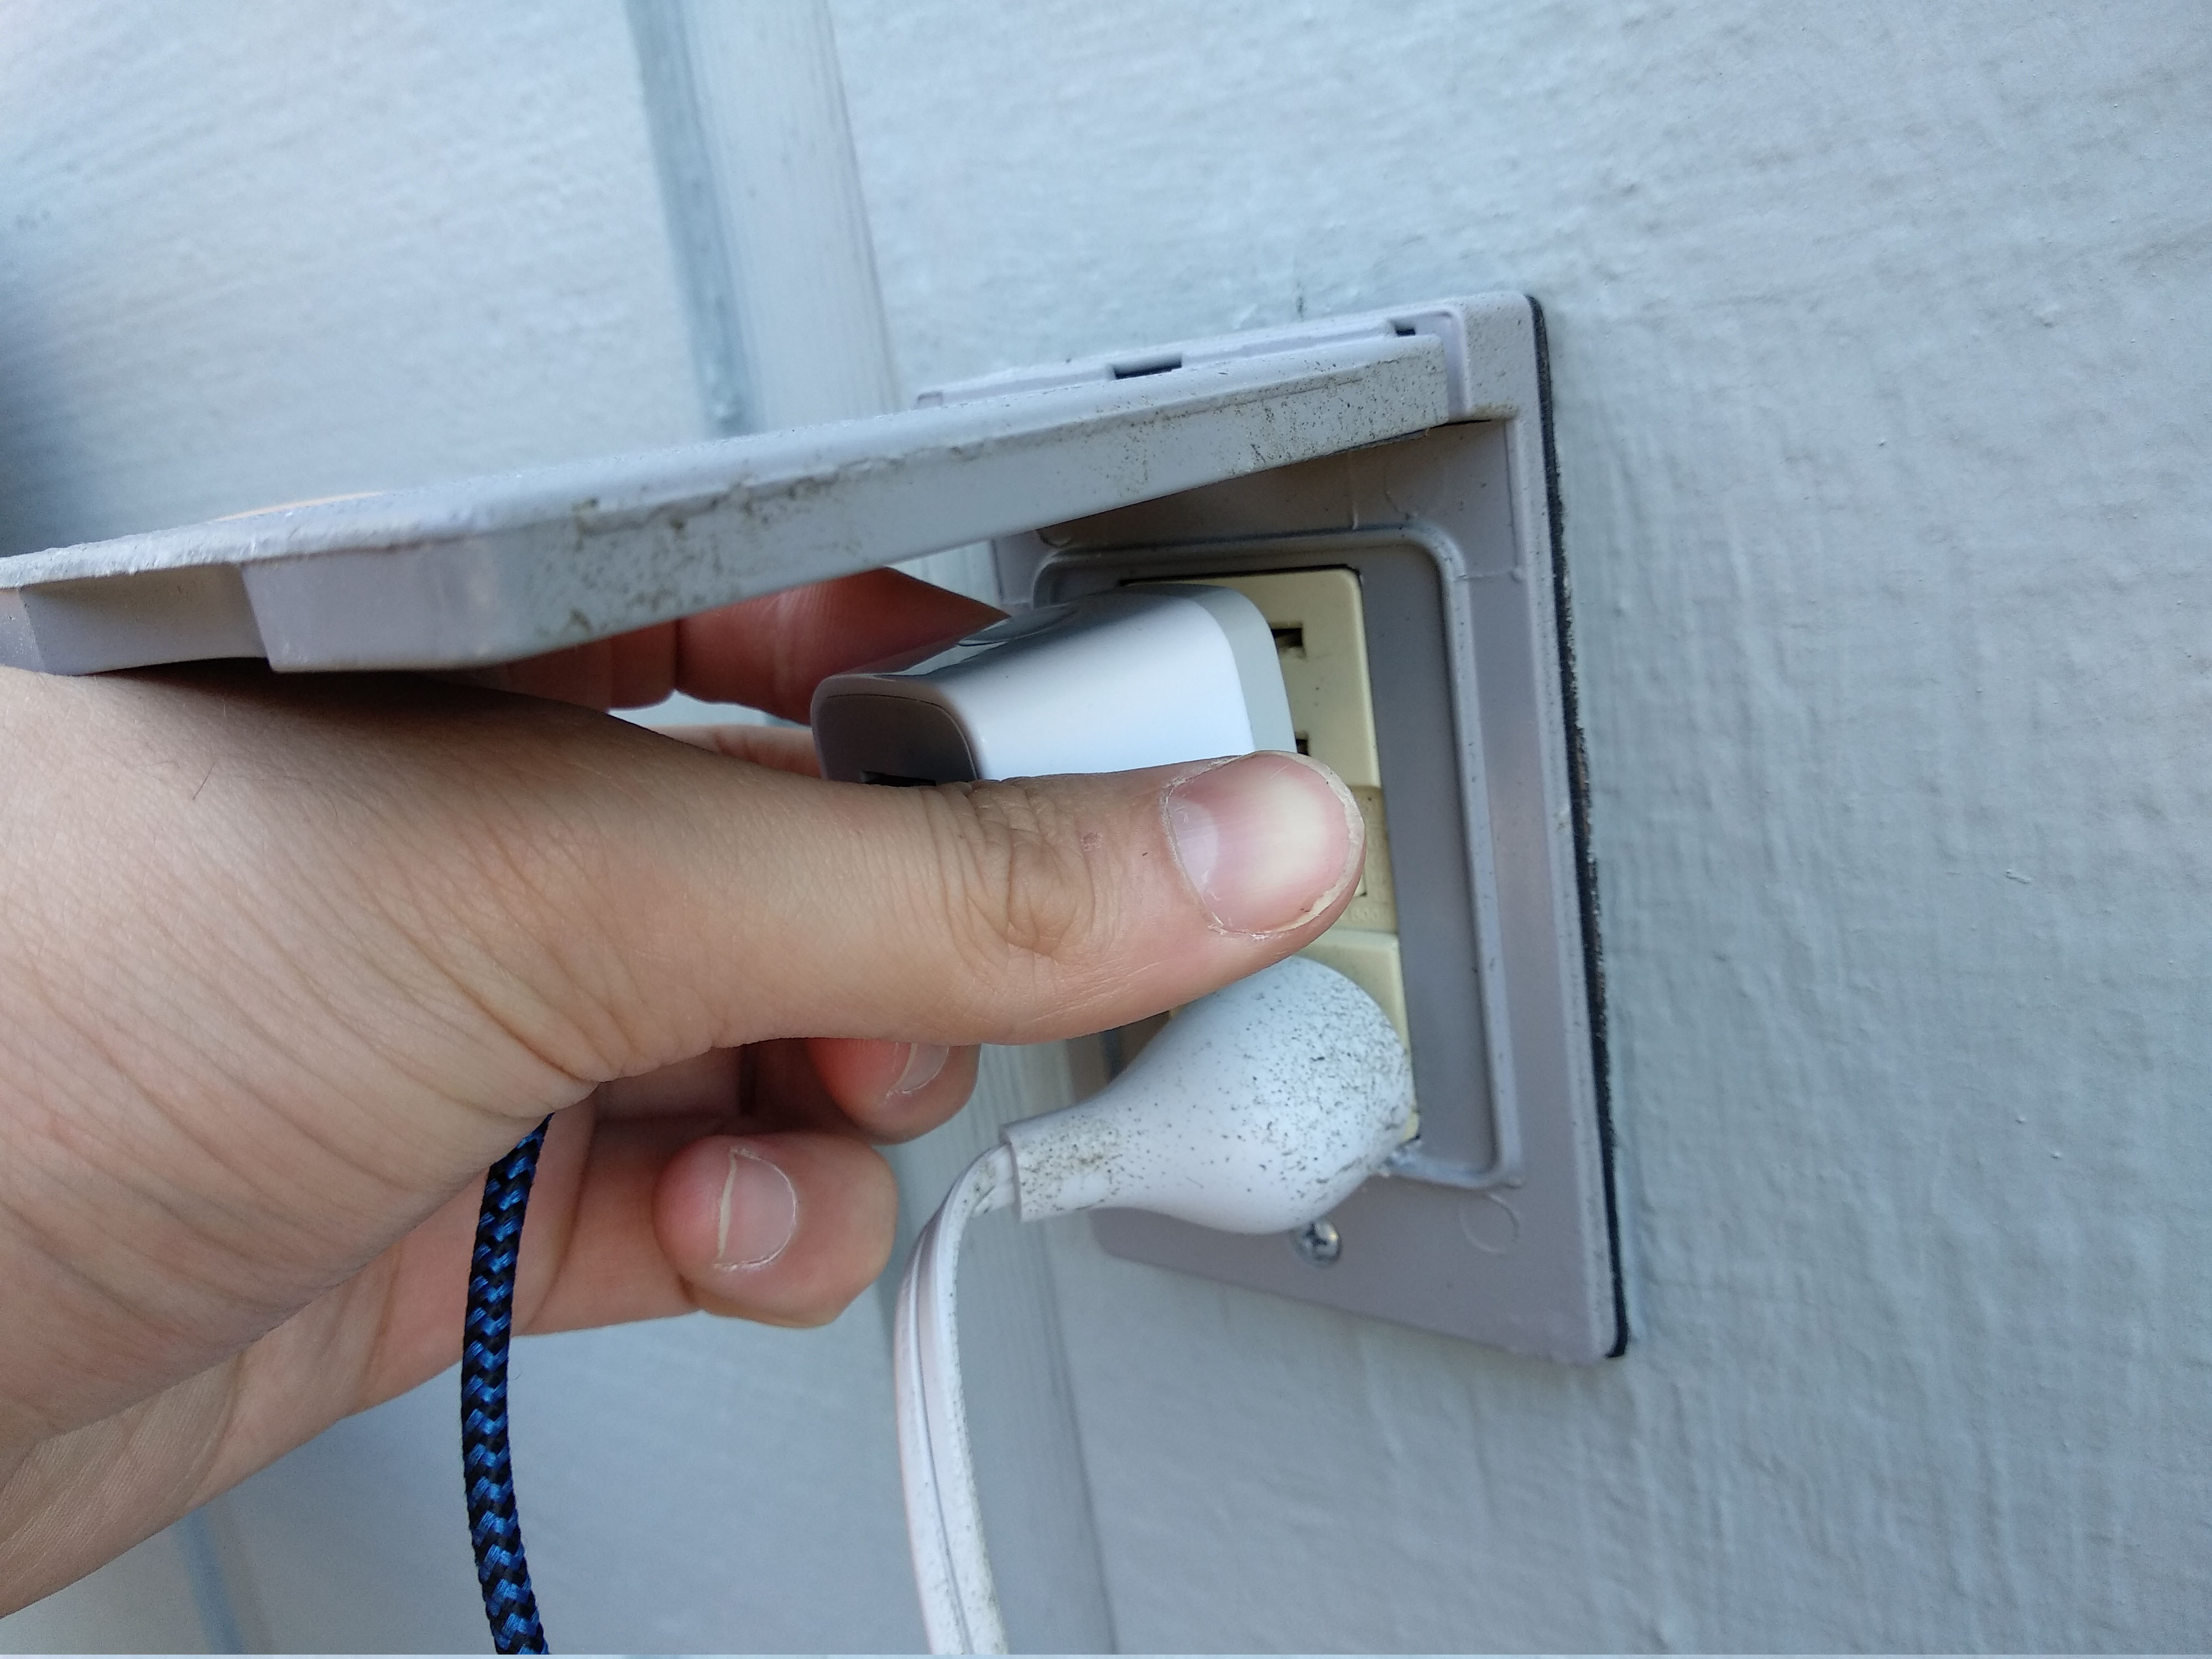
Task 3: Get Connected 
3.1 Plug the Flat USB Micro Nylon Cable to the Arduino Board 
3.3 Connect to the sensor's Access Point 

⚠️ Access Point not showing up?
If the Access Point does not show up in your list of Wi-Fi networks, try plugging the power supply in-and-out. It can take several attempts for the Access Point to show up.3.4 Configure the sensor's Wi-Fi connectivity 
3.5 Once you land on the Configuration Page, verify that all of your components are recognized 
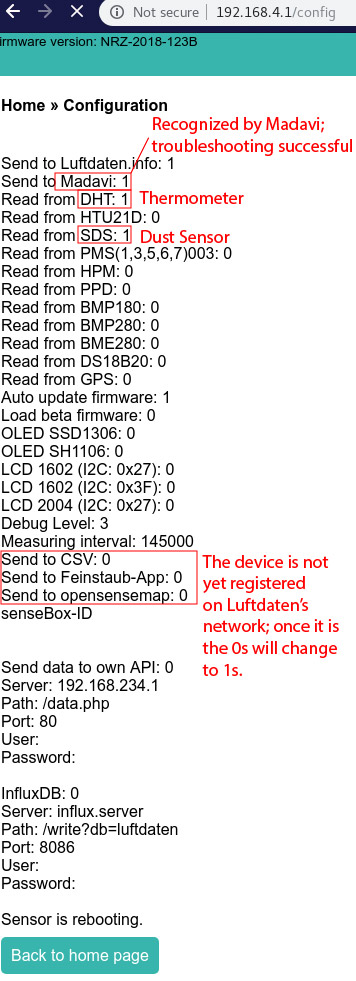
⚠️ What's Madavi.de?
Madavi.de is a hosting service used by Luftdaten of data graphed from your device in real time, for the purposes of troubleshooting (i.e. verifying whether your sensor has a reliable Wi-Fi connection, and whether the dust and thermometer data are communicated to the database).
Task 4: Troubleshooting 
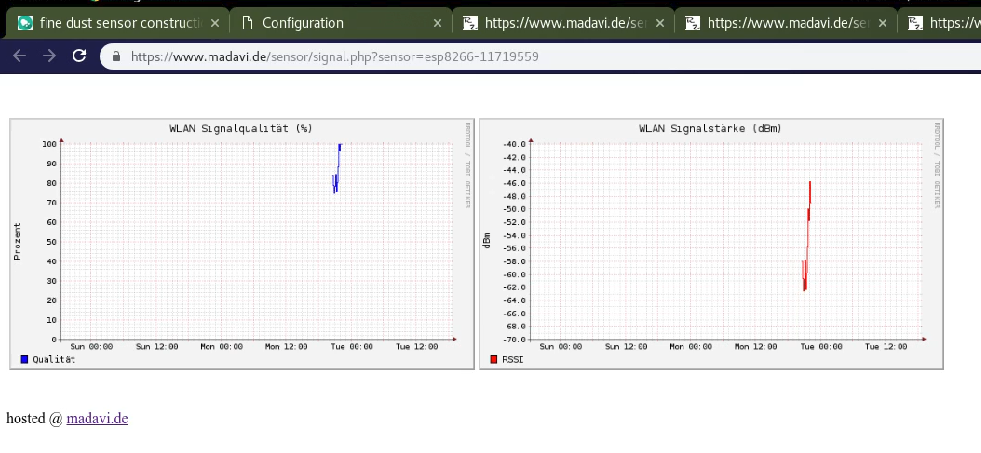
4.1 Verify your sensor's Wi-Fi connectivity 
Your device's connectivity is primordial in collecting data; the arduino does not nearly have enough memory to store the data, so if the Wi-Fi is disconnected then the data gets lost. Search for your device (by its unique ID) again: https://www.madavi.de/sensor/signal.php
⚠️ Why is the link to my sensor highlighted in red?
Your device isn't registered on Luftdaten's database yet. The purpose of the Madavi's links is to troubleshoot your sensor's connectivity and settings.
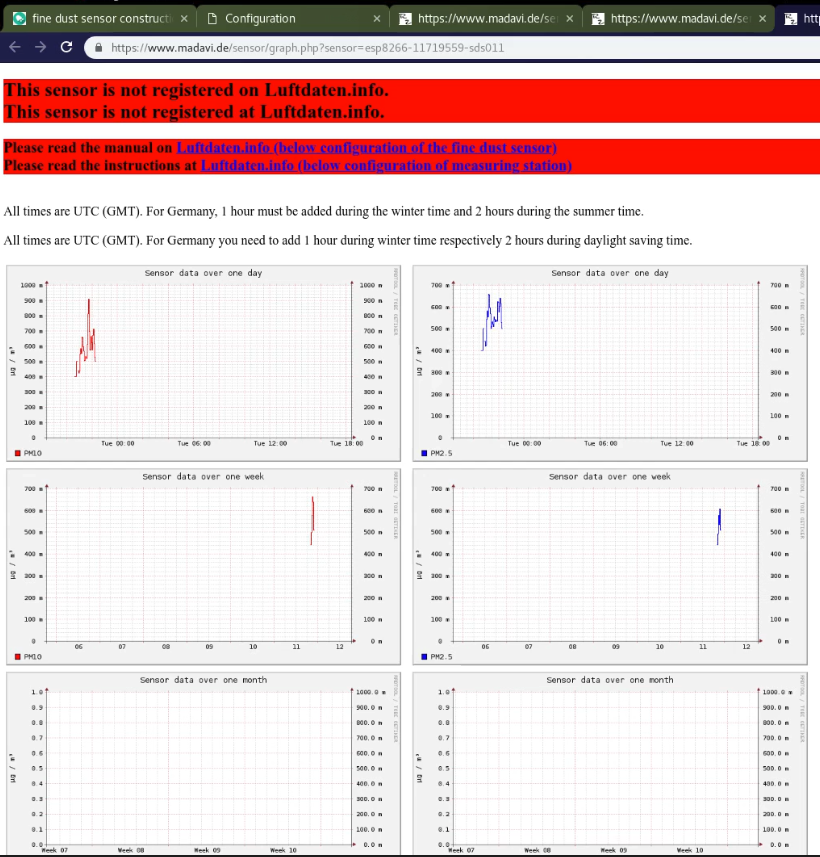
4.2 Check that you're getting the data 
Check if your sensor is emitting temperature/humidity and Fine Particles data in real time on Madavi: https://www.madavi.de/sensor/graph.php (search the link by your sensor's unique ID). All that you want to observe is whether lines are being drawn on your charts, indicating that measurements are taken in real-time.


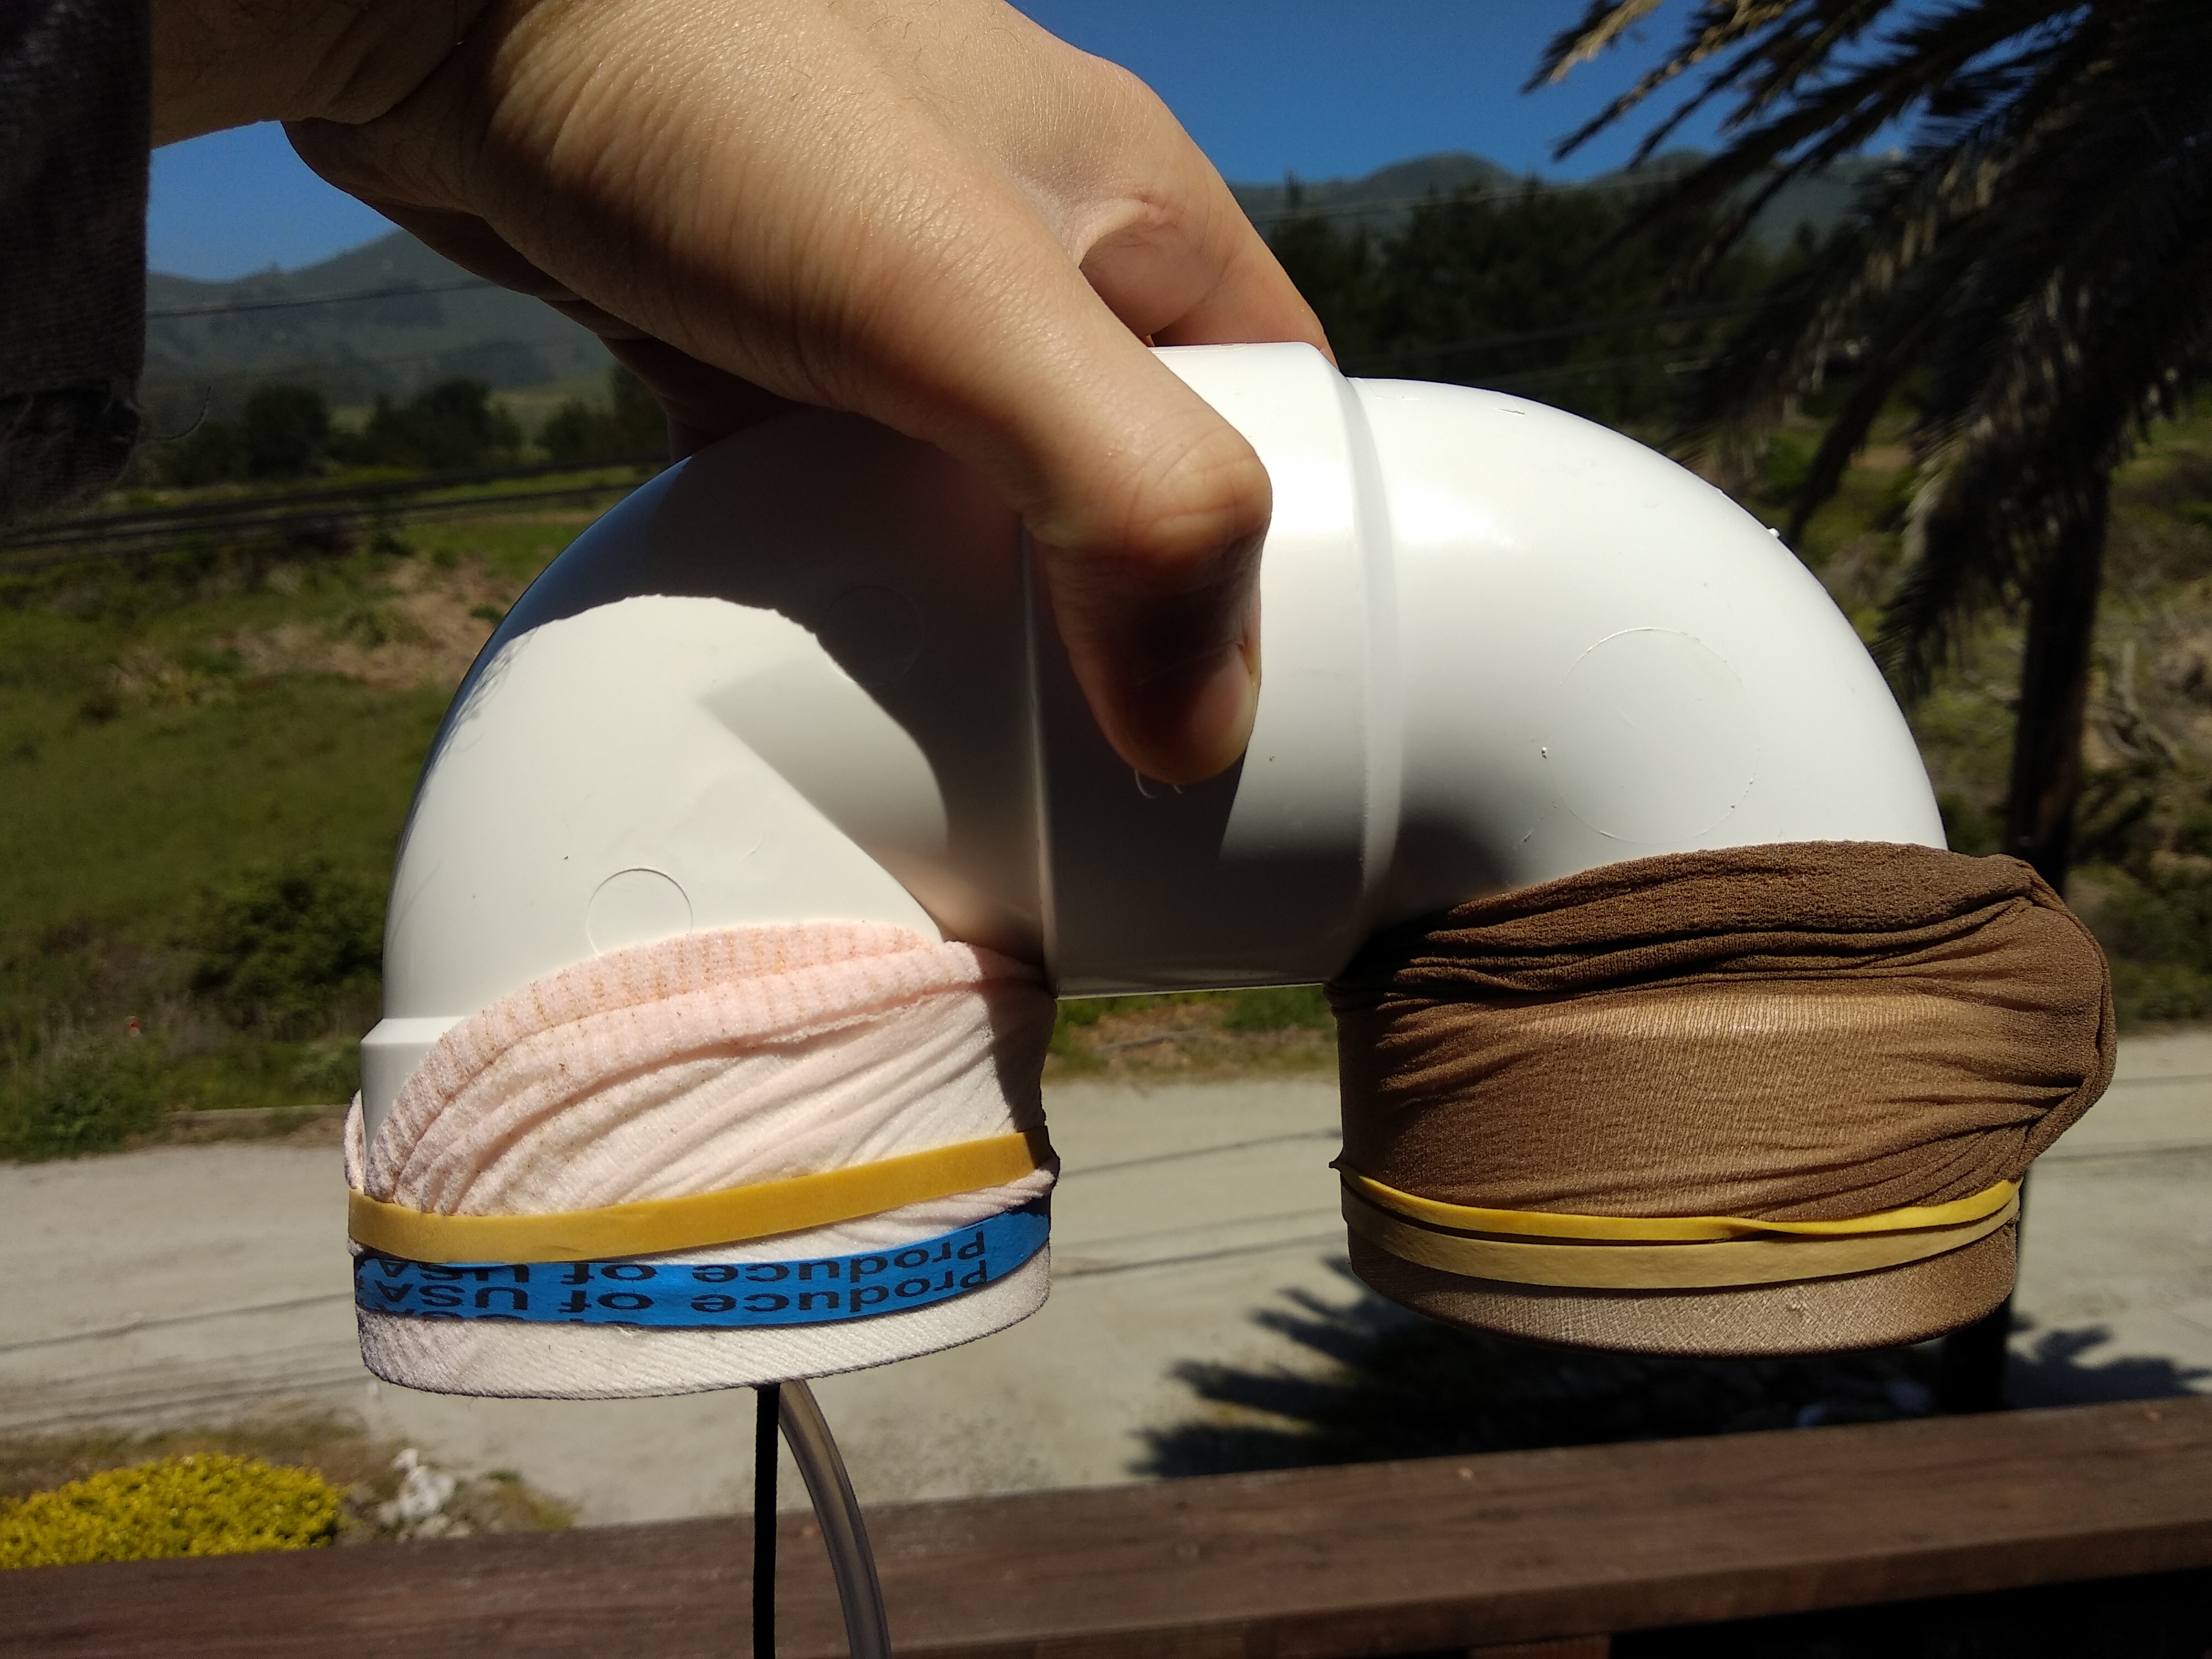
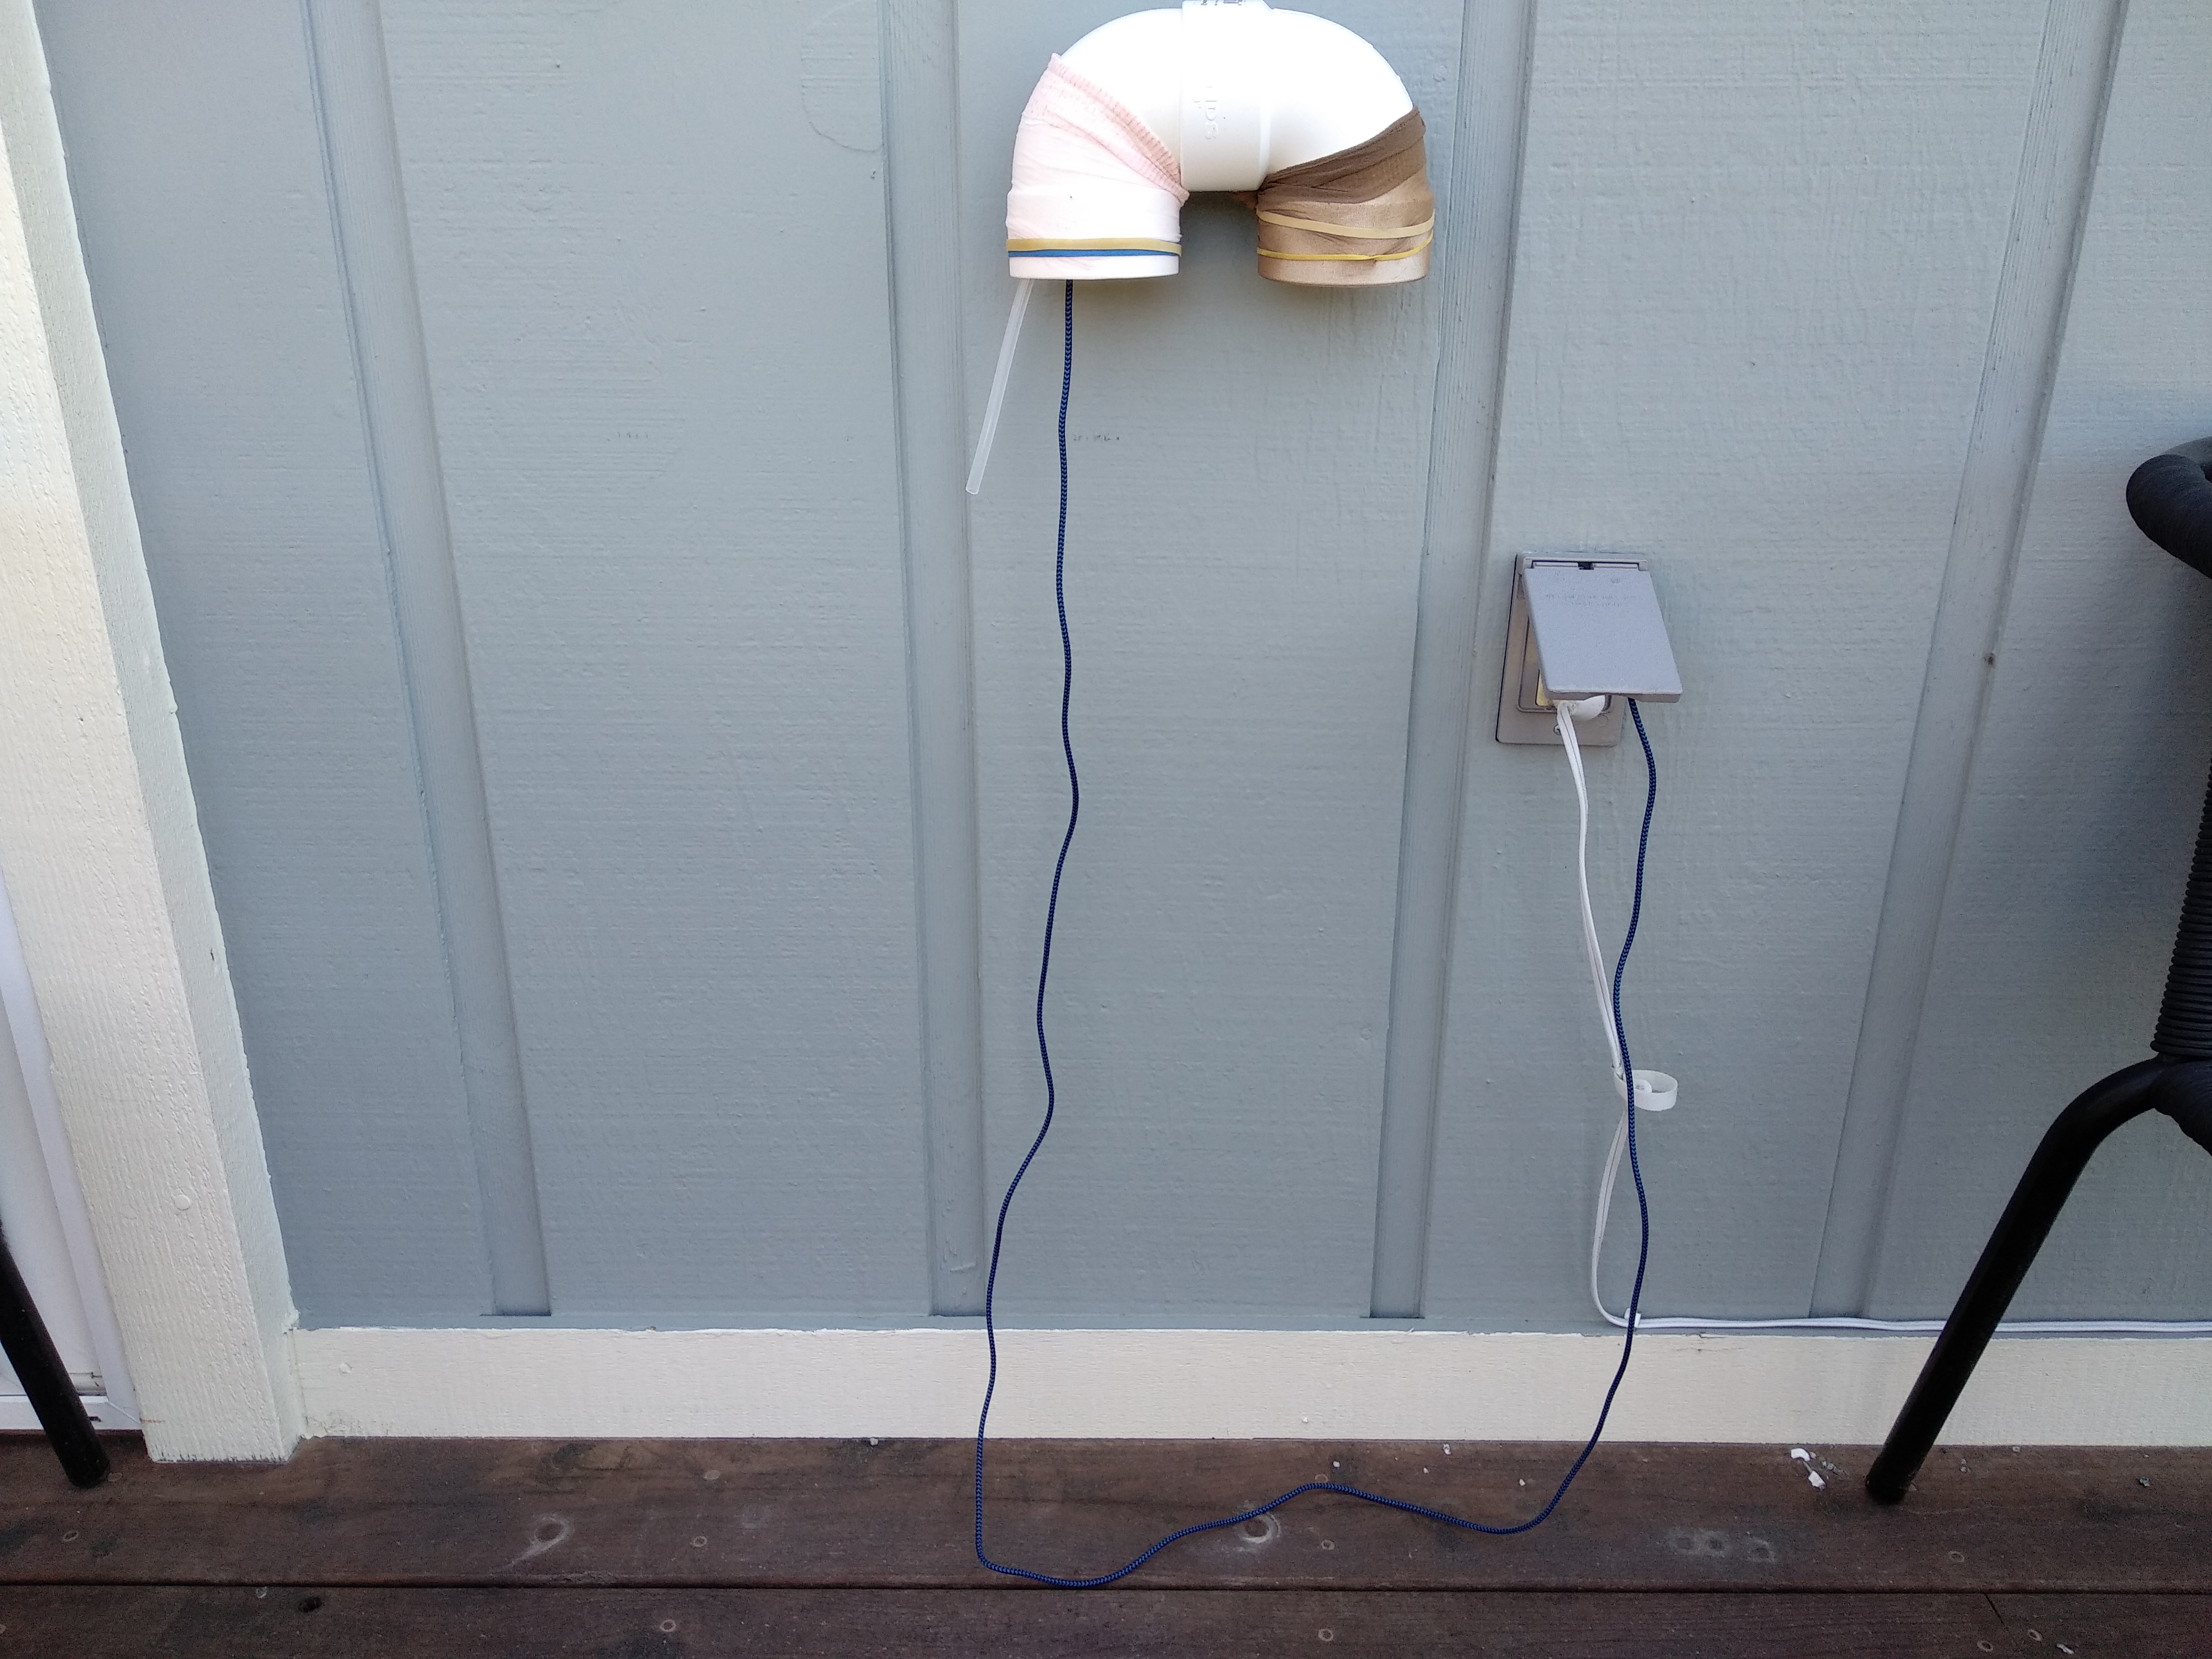
Task 5: Setting Up Your Sensor Outdoors 
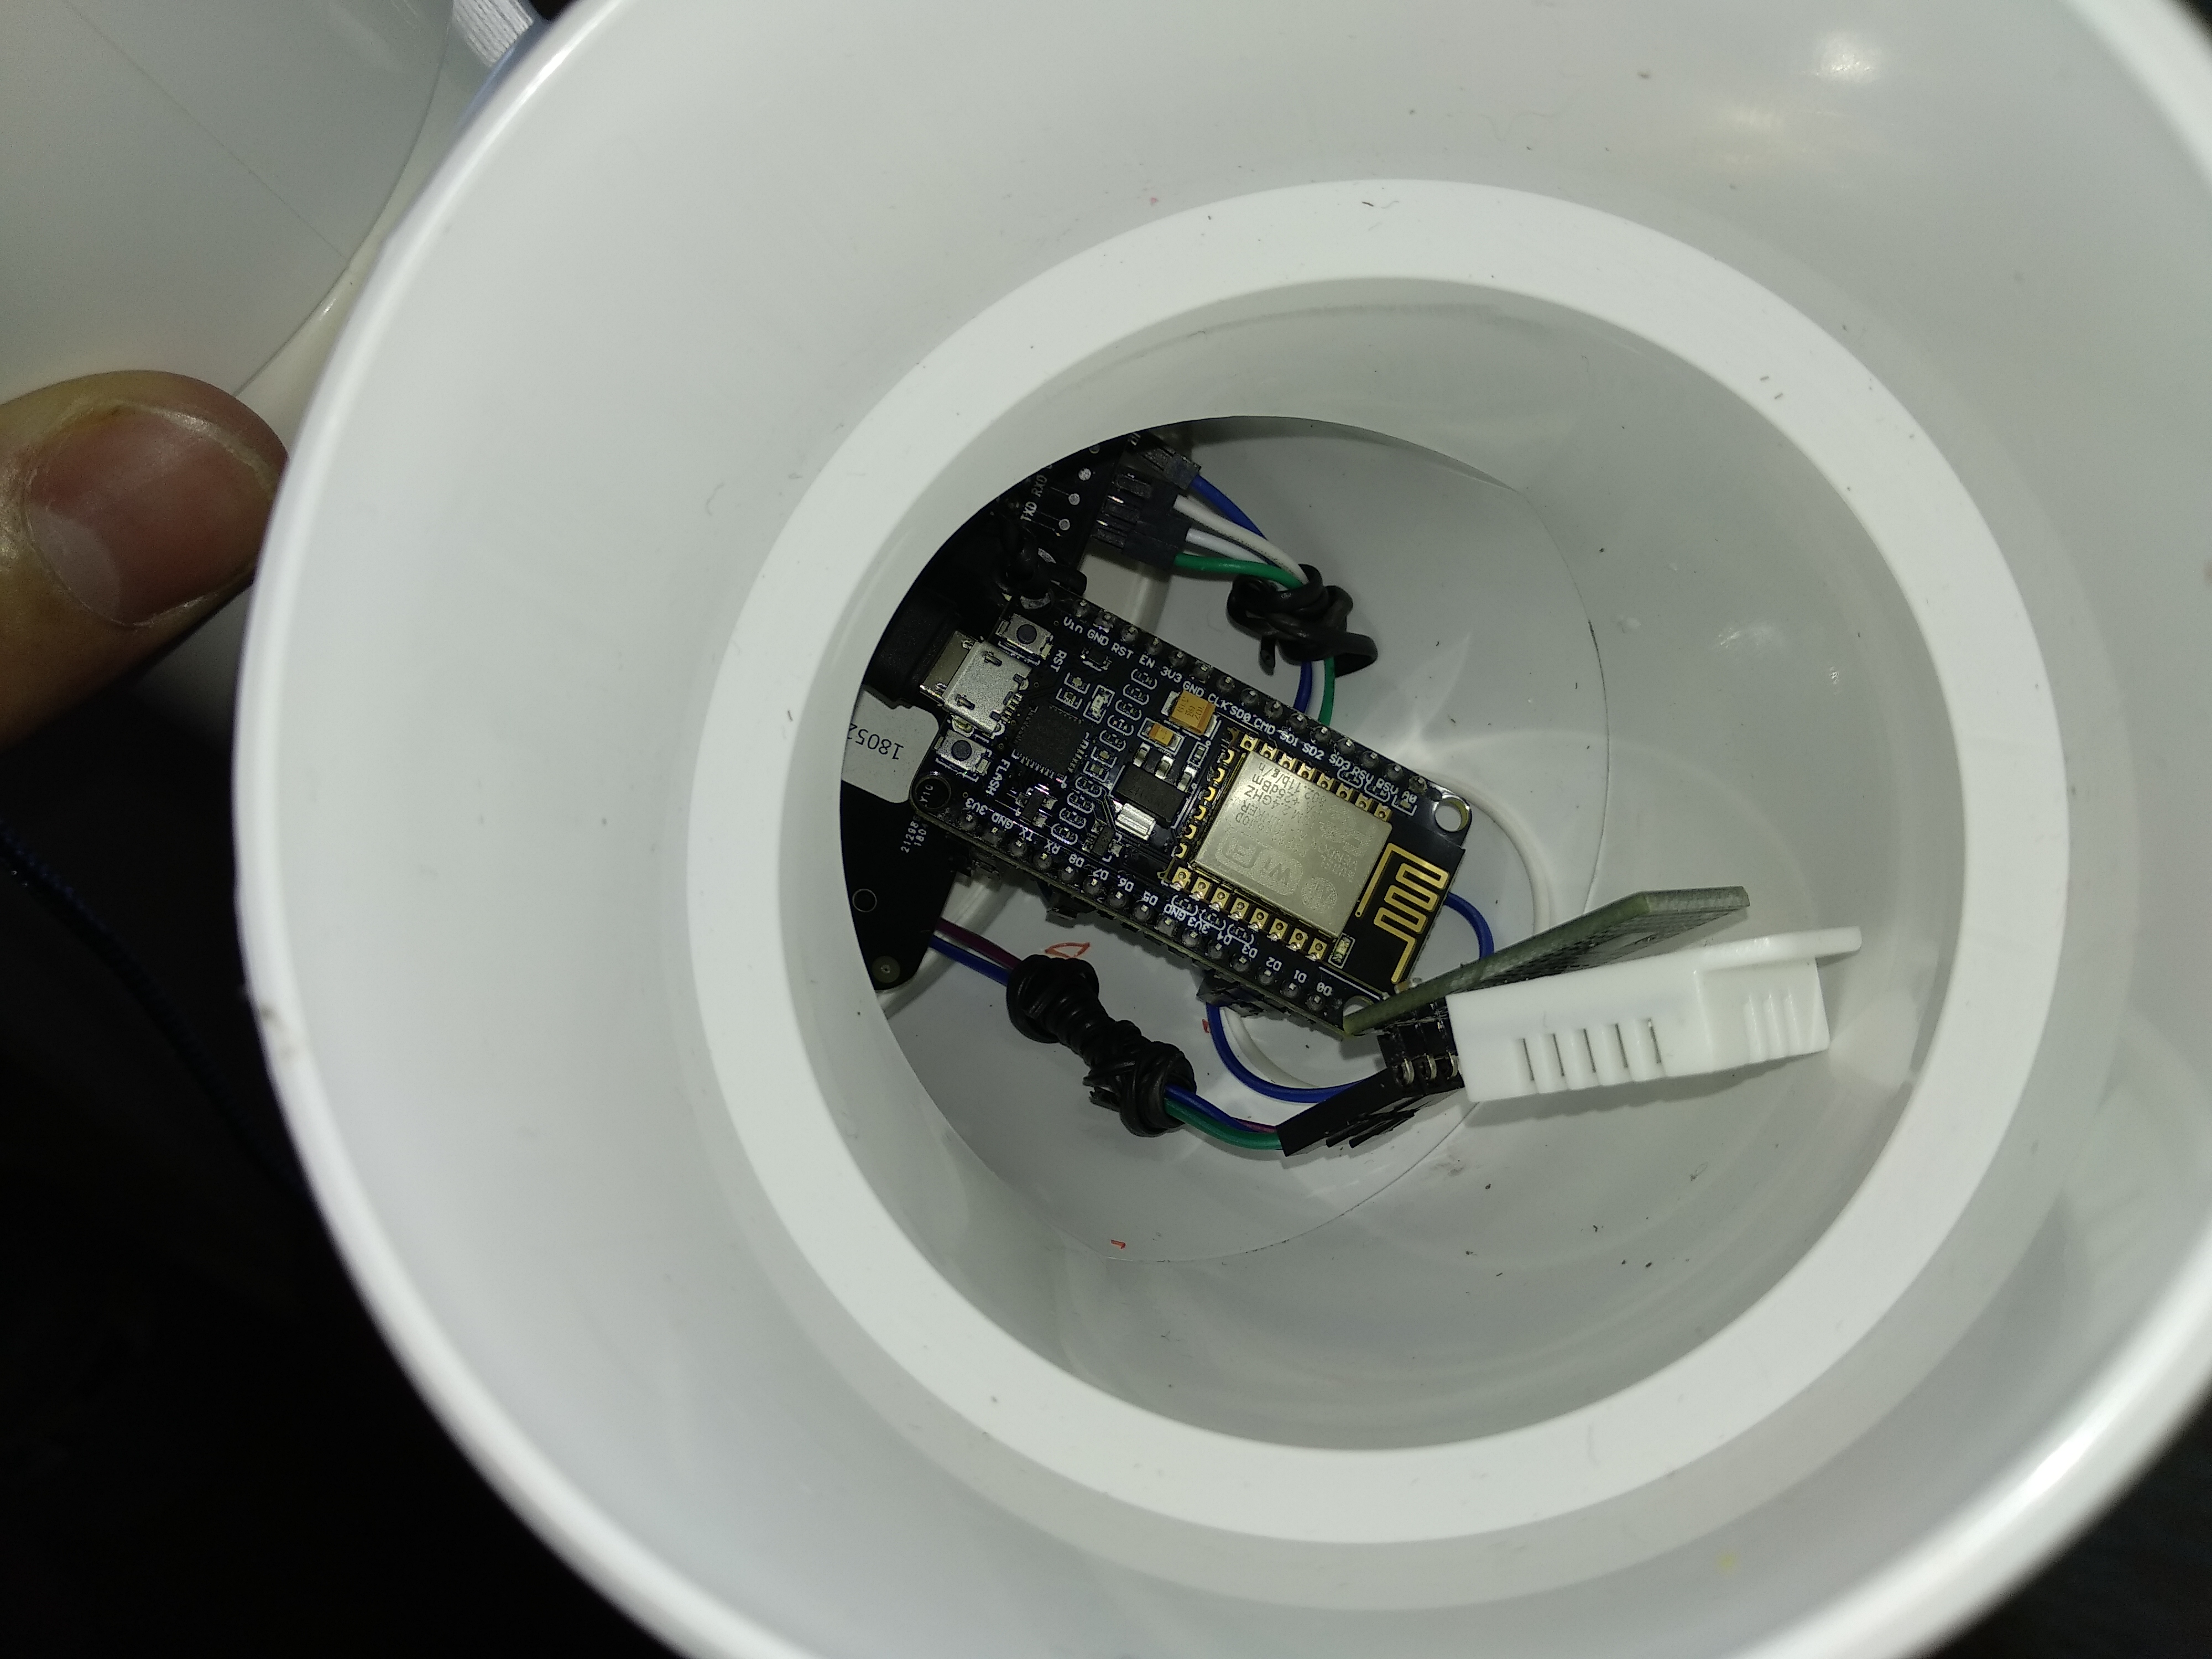
5.2 Set up your device inside the PVC Pipe 

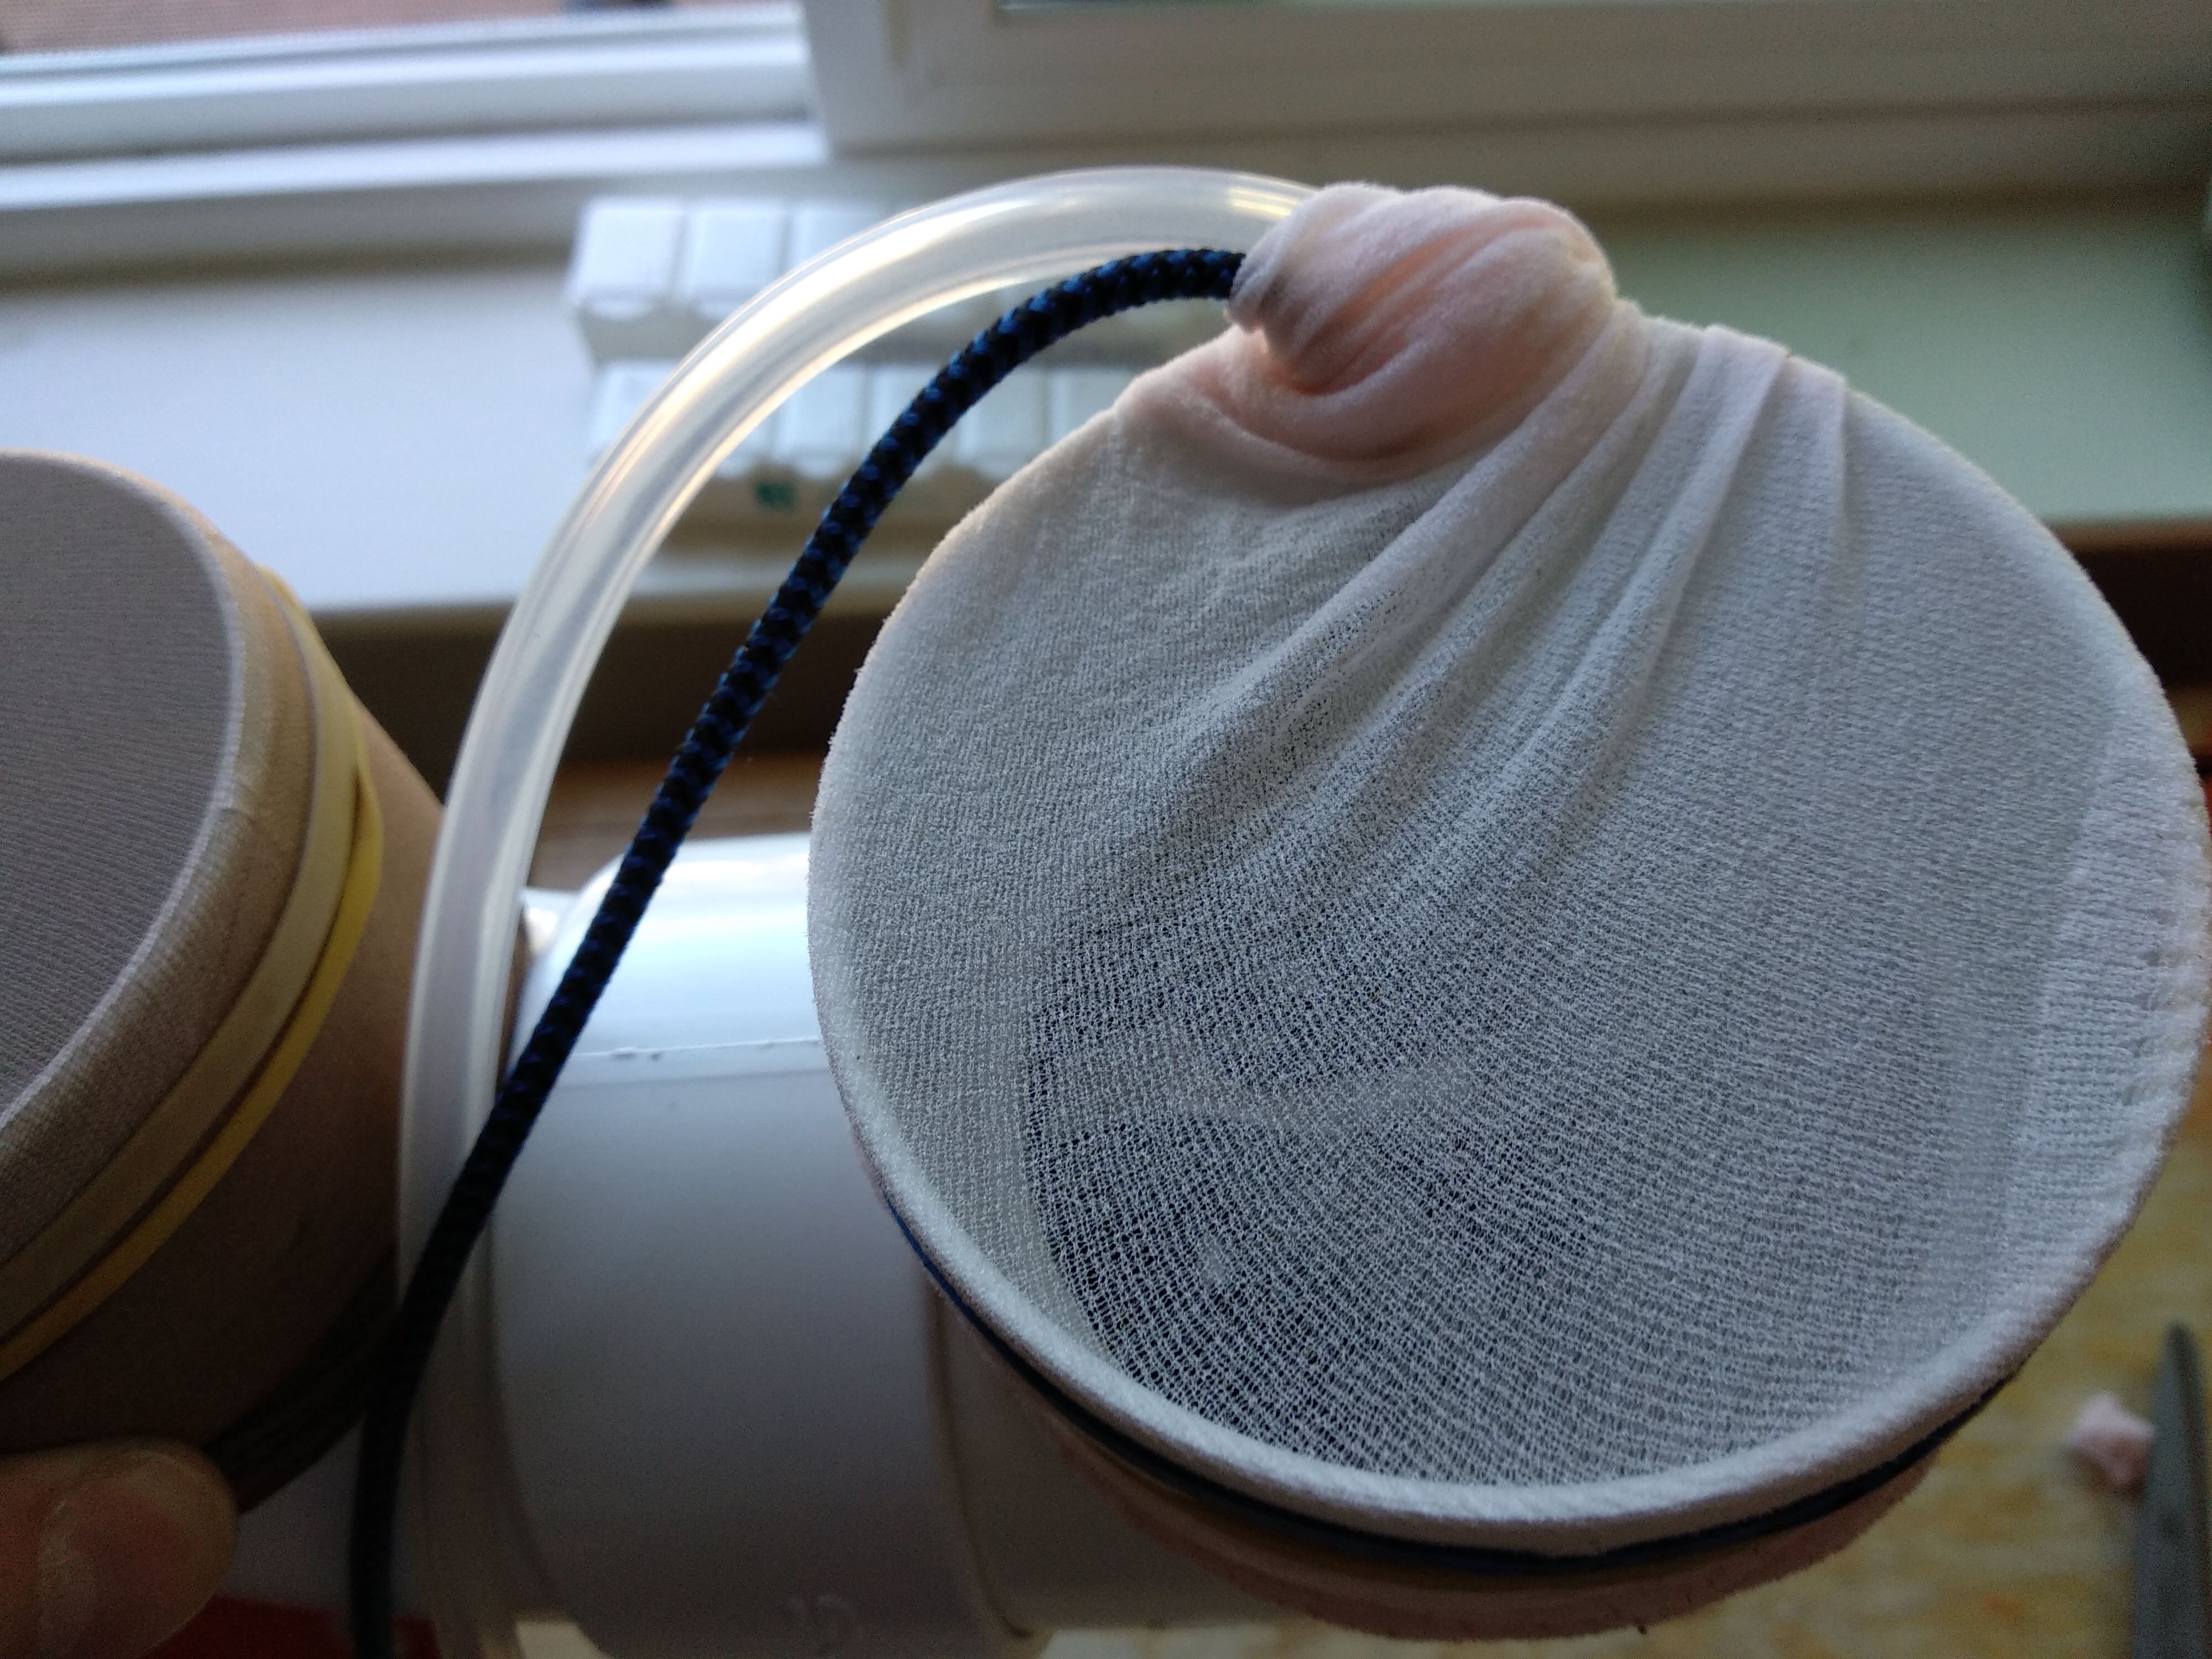
5.3 Seal both of the pipe's ends 
5.5 Troubleshoot once more your components' connectivity 
Repeat steps 4.1 and 4.2. It's always possible a dupont wire may have been disconnected while setting up your components in the PVC pipe, or that your power outlet doesn't work; in any case, troubleshoot, troubleshoot, troubleshoot!
Links to Madavi below: (once again, search by your sensor's unique ID)

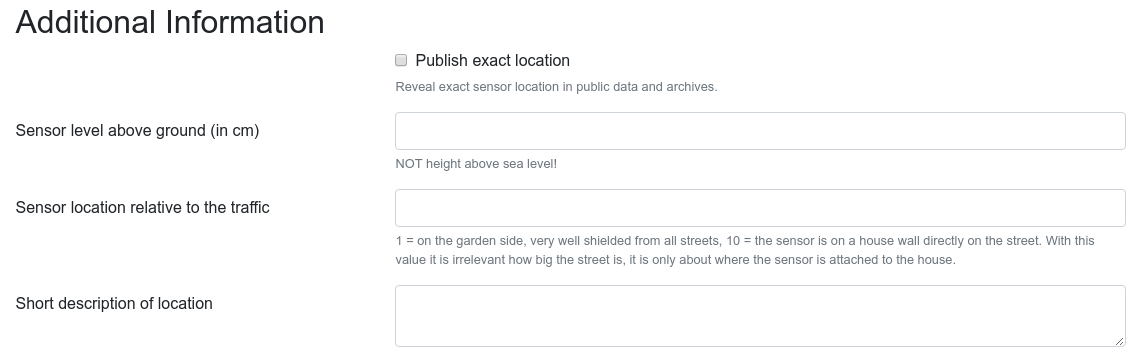
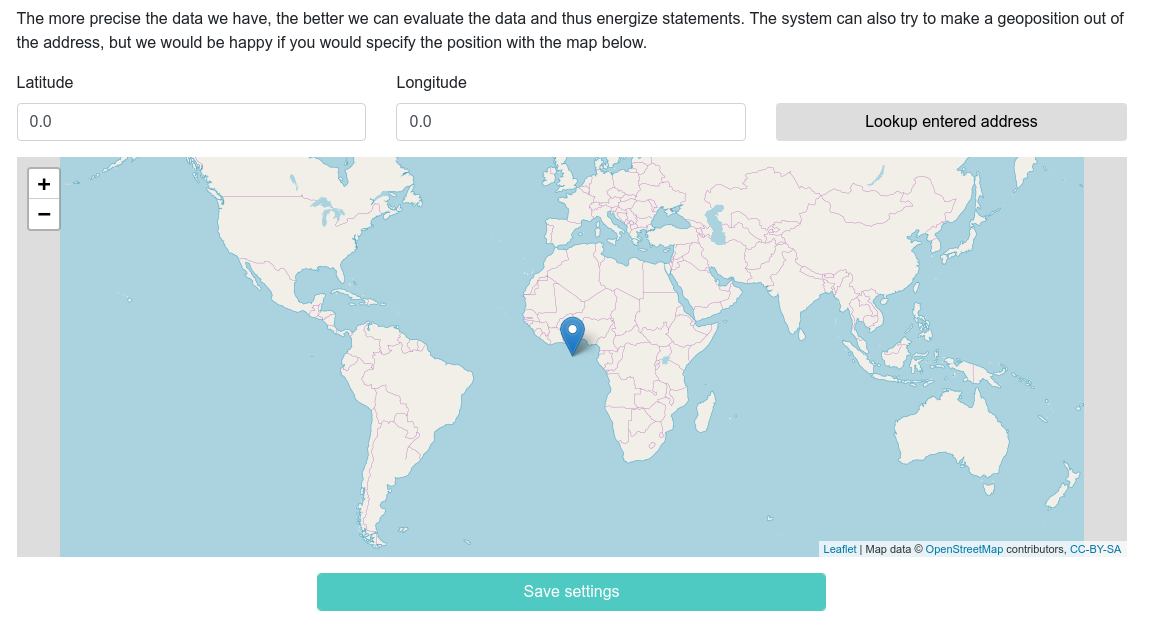
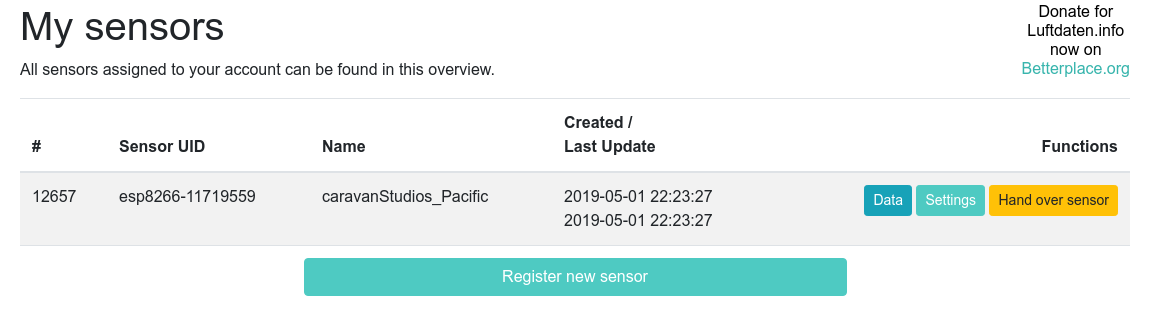
Task 6: Register On Luftdaten 
IFrame(src='https://meine.luftdaten.info/register', width=800, height=400)
You will receive a confirmation email to the address provided. Click the link to confirm your account and log-in with the credentials you used to register.
IFrame(src='https://meine.luftdaten.info/login', width=800, height=400)
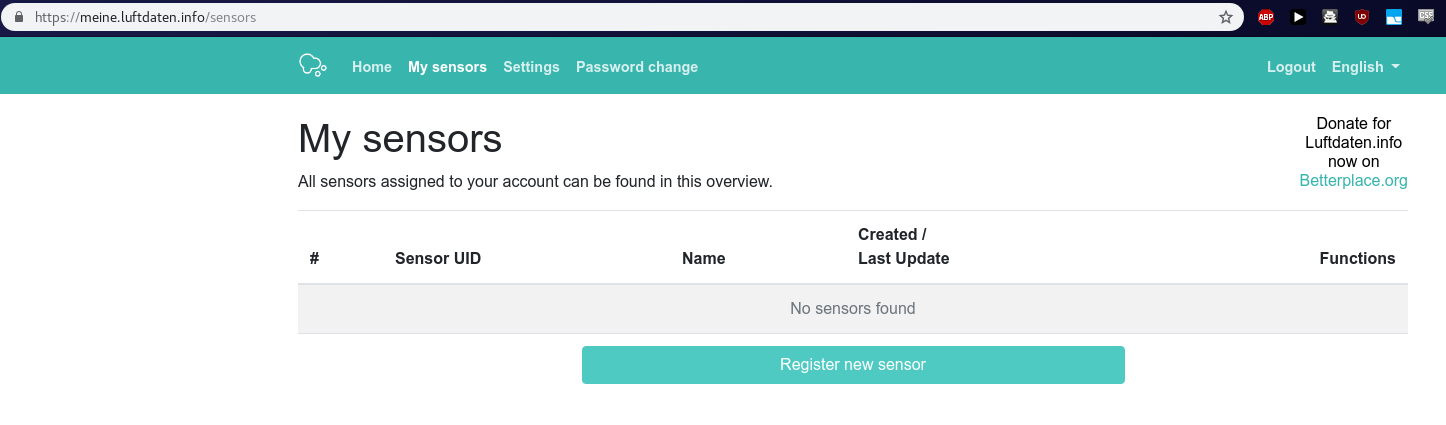


Your sensor is now registered on Luftdaten! 
Task 7: Data & You
Check your device's location on Luftdaten's Map! 
There isn't a search bar; to find your device zoom-in on its known location; note that the sensor's location is mapped at a resolution up to 100 meters
IFrame(src='https://deutschland.maps.luftdaten.info/#16/37.5436/-122.5123', width=1000, height=350)
But I want to do SOMETHING with the data! 
You will need to search the directory by your device's unique ID once again (CTRL + F).

Show me the (meta)data! 
| Field | Description |
|---|---|
| Time | In UTC (Coordinated Universal Time), convert the time and date of your measurement to match your timezone. You will also notice that the sensor is taking measurement at intervals of about 150 seconds: For 125 seconds, the SDS011 is shut down & the fan is off. Then for 20 seconds, the SDS011 is activated and the fan is on. For the last 5 seconds measurements are taken, averaged, and saved to Luftdaten's servers. |
| durP1 | |
| ratioP1 | |
| P1 | |
| durP2 | |
| ratioP2 | |
| P2 | |
| SDS_P1 | Coarse Dust Particles (PM10), less than 10 to 2.5 microns in diameters, measurements in µg/m3 (micrograms per meter cubed) averaged over 20 seconds of data collection |
| SDS_P2 | Fine Particles (PM2.5), less than 2.5 microns, measurements in µg/m3 (micrograms per meter cubed) averaged over 20 seconds of data collection |
| PMS_P1 | |
| PMS_P2 | |
| Temp | In degrees Celcius (°C) |
| Humidity | Measured as the percentage of saturation humidity |
| BMP_temperature | |
| BMP_pressure | |
| BME280_temperature | |
| BME280_humidity | |
| BME280_pressure | |
| Samples | The number of measurements taken within the span the Dust Sensor is activated; the raw particle measurements (SDS_P1 & SDS_P2) are averages of those samples |
| Min_cycle | |
| Max_cycle | |
| Signal | |
| HPM_P1 | |
| HPM_P2 |
OK here's some dank data, what now? 
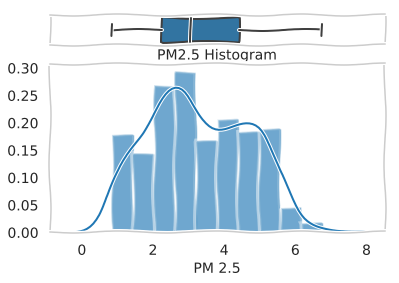
Histograms 
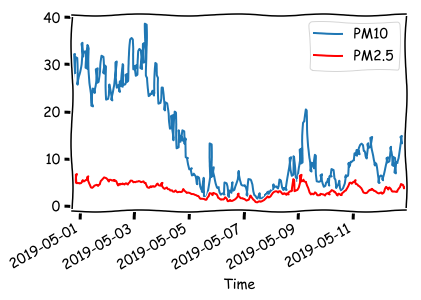
Timeseries 
Play to your strenghts! Data is a means to an end: explore, ask questions, relate quantitative evidence with your own day-to-day qualitativde observations! Start simple and make your life miserable by getting better.